




Case study
Brewie: a smarter way to manage a self-service coffee network
Brewie is a network of self-service coffee stations operating 24/7 across multiple cities. As the network grows, managing stations, tracking sales, monitoring inventory and coordinating teams becomes increasingly complex. My challenge was to bring these operations into one intuitive dashboard, giving the team a clear view of the entire network and the tools to manage it efficiently.
My role
Product Designer
Scope
UX architecture / User flows / UI design / Design system / Prototyping
Main goals
- One place to understand the whole network
- Operational issues that are quick to spot and act on
- Simple control over menus, prices and branding at every location
Stage 1 · The challenge
Managing a growing network shouldn’t mean managing multiple tools
Running a self-service coffee network involves much more than tracking sales. Operators need to monitor machine availability, inventory levels and maintenance issues. Franchise owners want visibility into location performance. Administrators need control over menus, pricing, branding and team permissions.
When these responsibilities are spread across different tools, even simple tasks become unnecessarily complicated. The challenge was to create a single system that supports everyday operations without overwhelming users with information.
Three problems to solve
Problem
01Fragmented information. Operational data was spread across Telegram, spreadsheets, CRM systems and direct communication.
What users needed
One place to understand what was happening across the network.
Problem
02Limited visibility into operational issues. An offline machine or low inventory could directly affect sales.
What users needed
To spot problems quickly, understand their priority and know what to do next.
Problem
03Complex management across locations. Stations needed individual settings for menus, prices and branding.
What users needed
A straightforward way to manage these differences without extra complexity.
The design goal
Create one operational workspace where users can monitor, manage and improve the entire coffee network.
Stage 2 · Product strategy
Turning operational complexity into a clear product structure
The dashboard needed to serve users with different responsibilities. Rather than organizing the experience around disconnected tools, I focused on the actions users needed to perform. This led to three core principles.
- 01See what matters
An immediate overview of station availability, sales performance and operational issues.
- 02Act with confidence
Move from identifying a problem to taking action, without searching through multiple sections.
- 03Improve performance
Understand how locations and products perform to make better operational decisions.
Information architecture
I organized the product around the dashboard. Each section is responsible for a clear set of tasks and is one step away from the dashboard, so navigation stays predictable across the product.
Stage 3 · Key design decisions
From the network overview to every station
Five decisions shaped the core of the product. Each one answers a specific question users have when they open the dashboard.
Making the entire network visible at a glance
Problem 01
Design question
How might we help operators understand the state of the network within seconds?
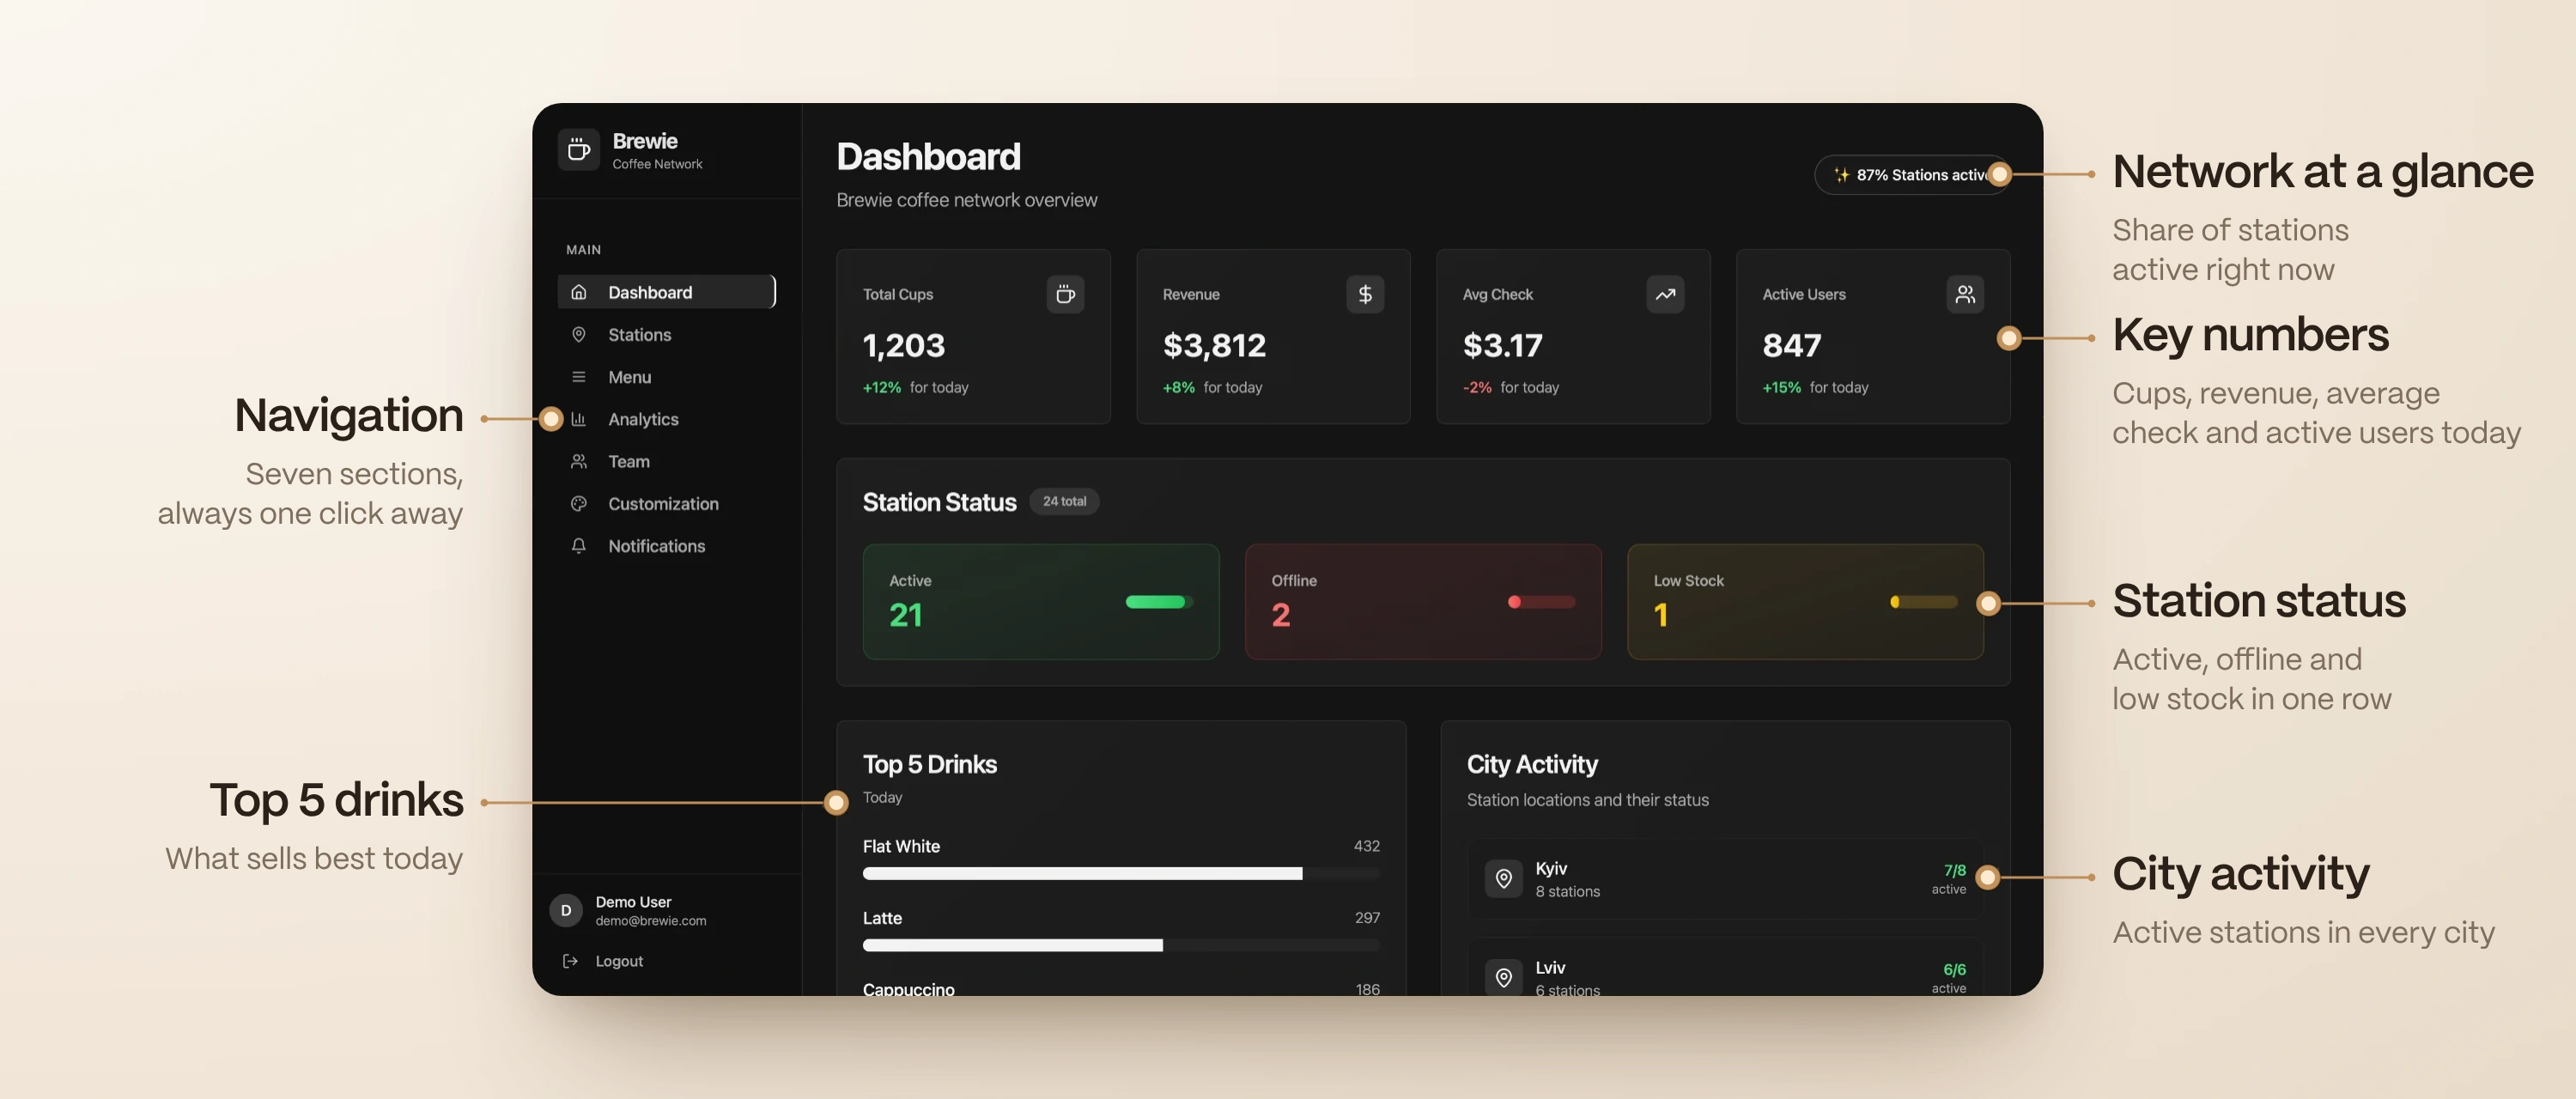
The dashboard is the starting point for everyday operations. Instead of giving all information equal importance, I organized the screen around the questions users are most likely to ask: is the network operating normally, are there any issues that need attention, and how is the business performing today?
What I did
- Key indicators at the top: cups sold, revenue, average order value and active users
- Station statuses separate active machines, offline stations and those running low on supplies
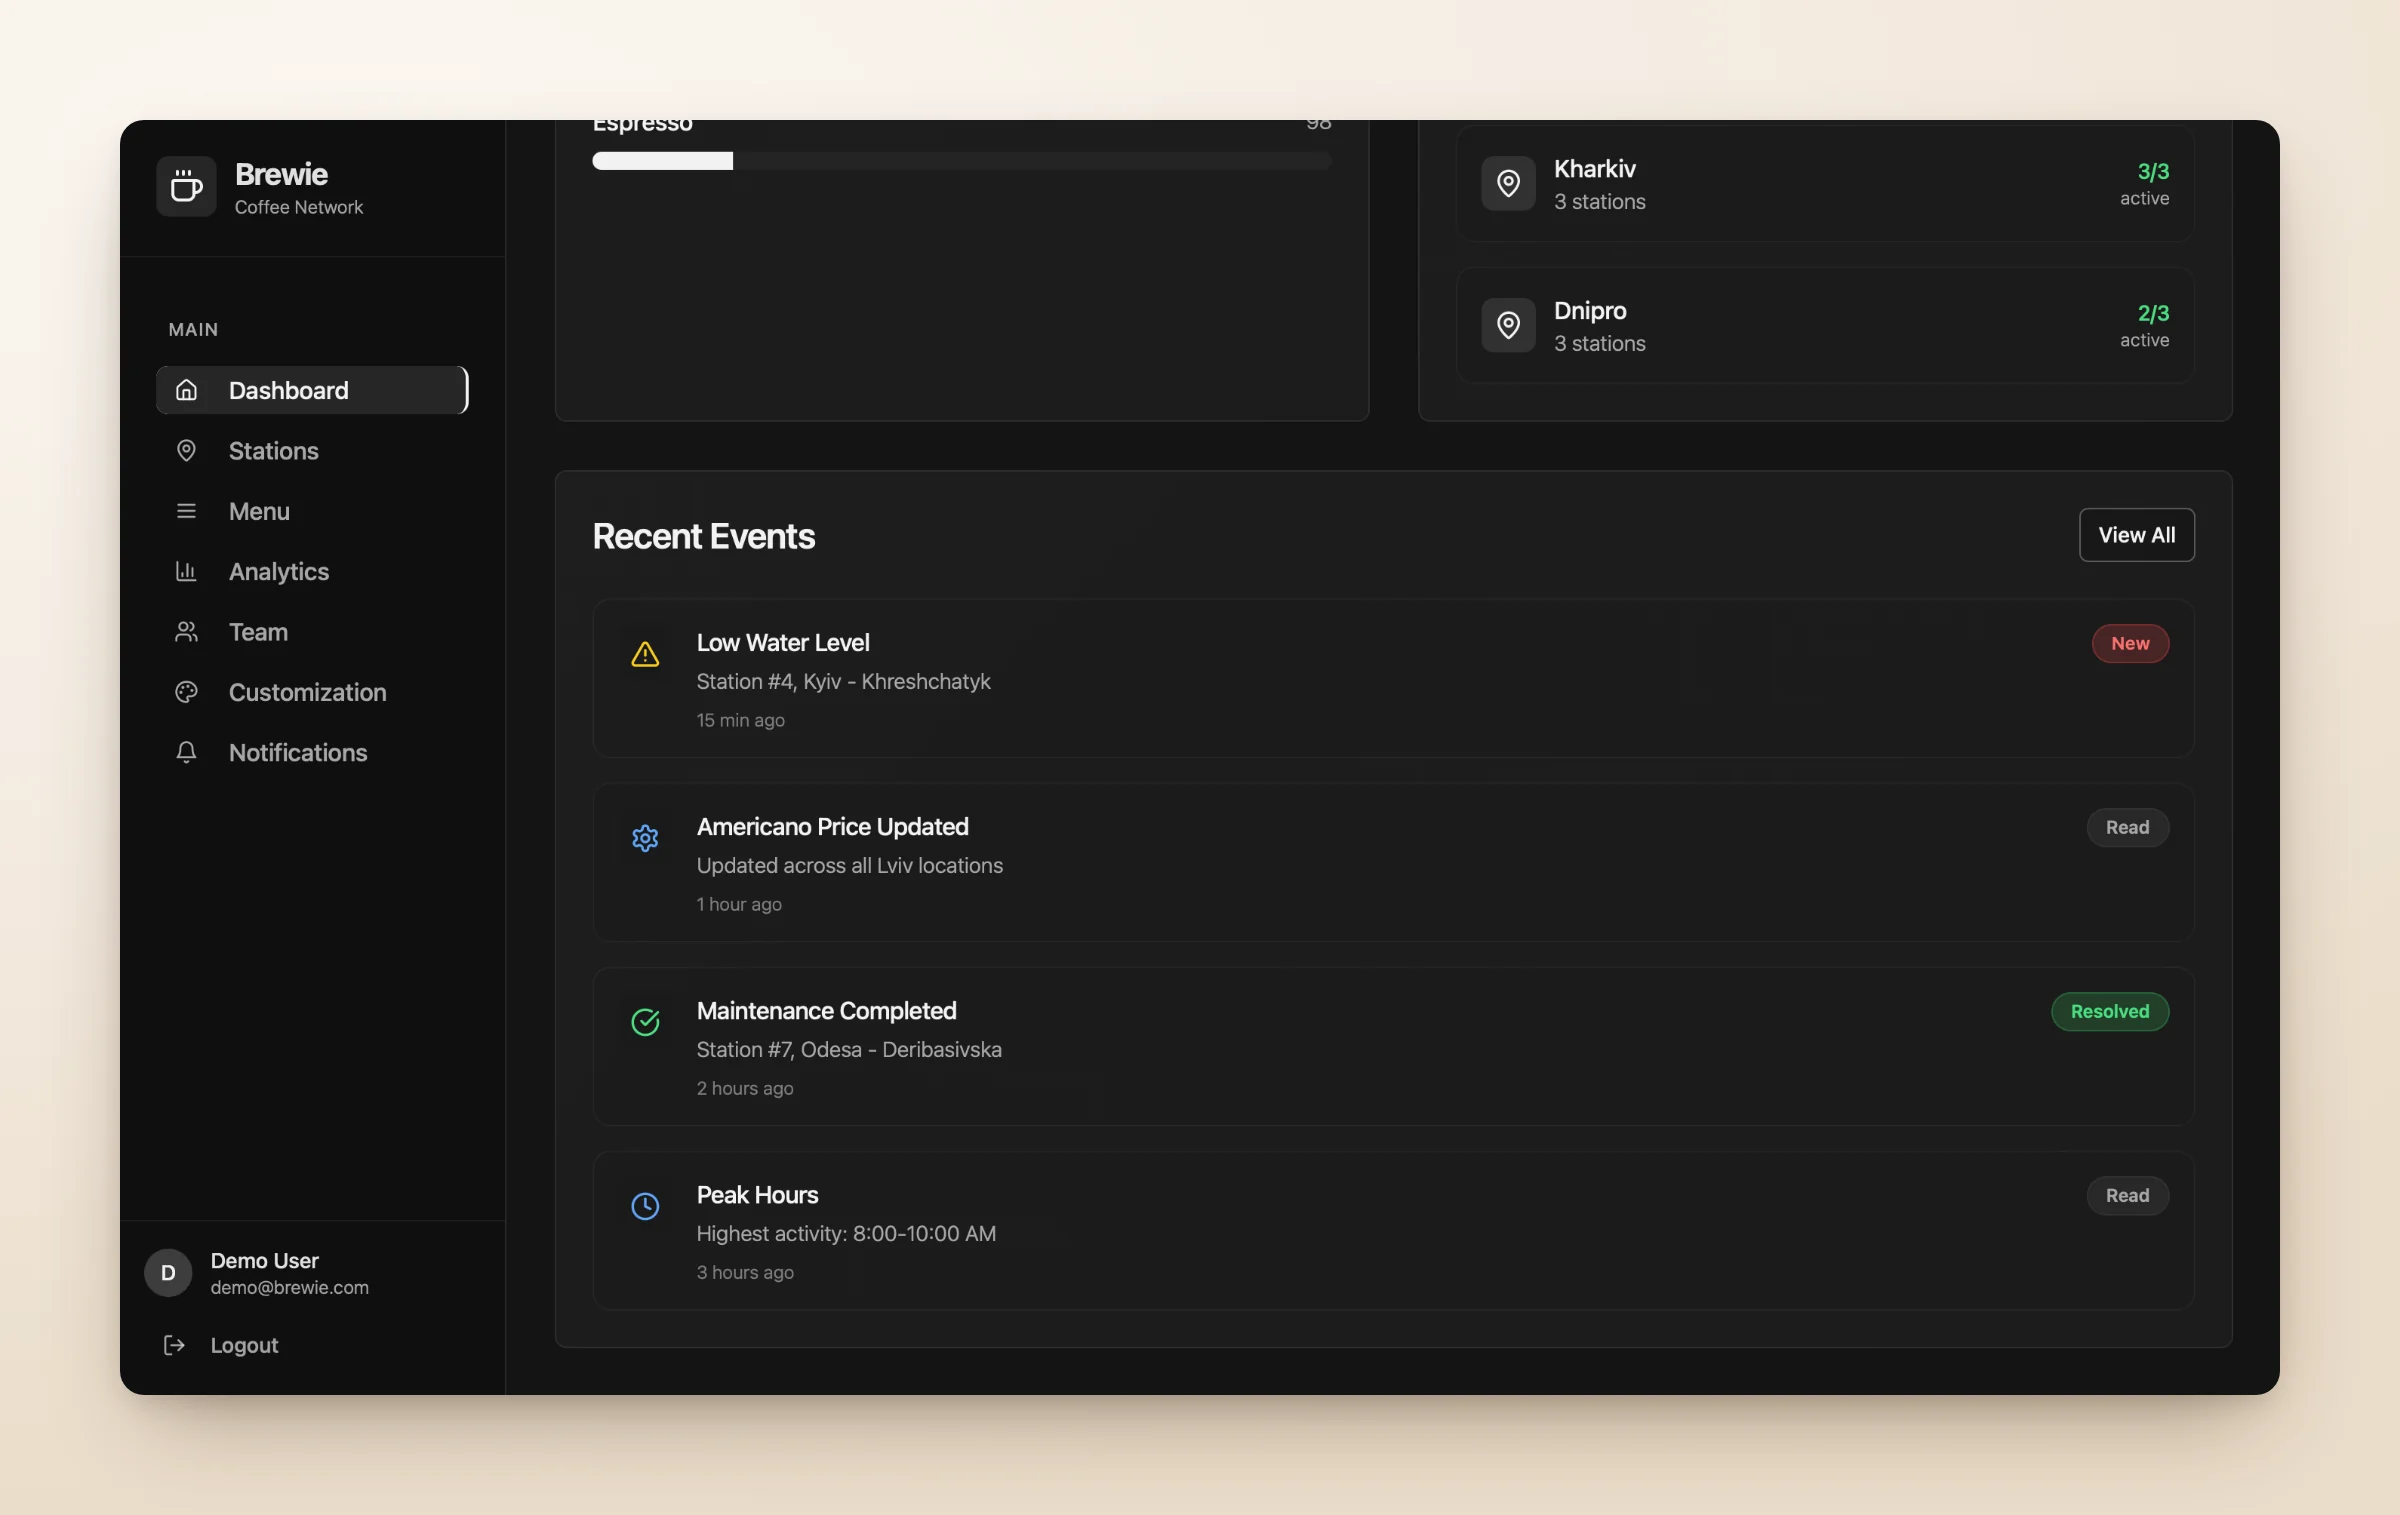
- Top-selling drinks and city activity add business context
- Recent events keep operators informed about changes across the network
Why it matters
The dashboard combines business performance with operational health. Users don’t need to open separate sections just to understand whether the network is working as expected.
Designing around problems, not just machine data
Problems 01 and 02
Design question
How might we make operational issues easier to identify and resolve?
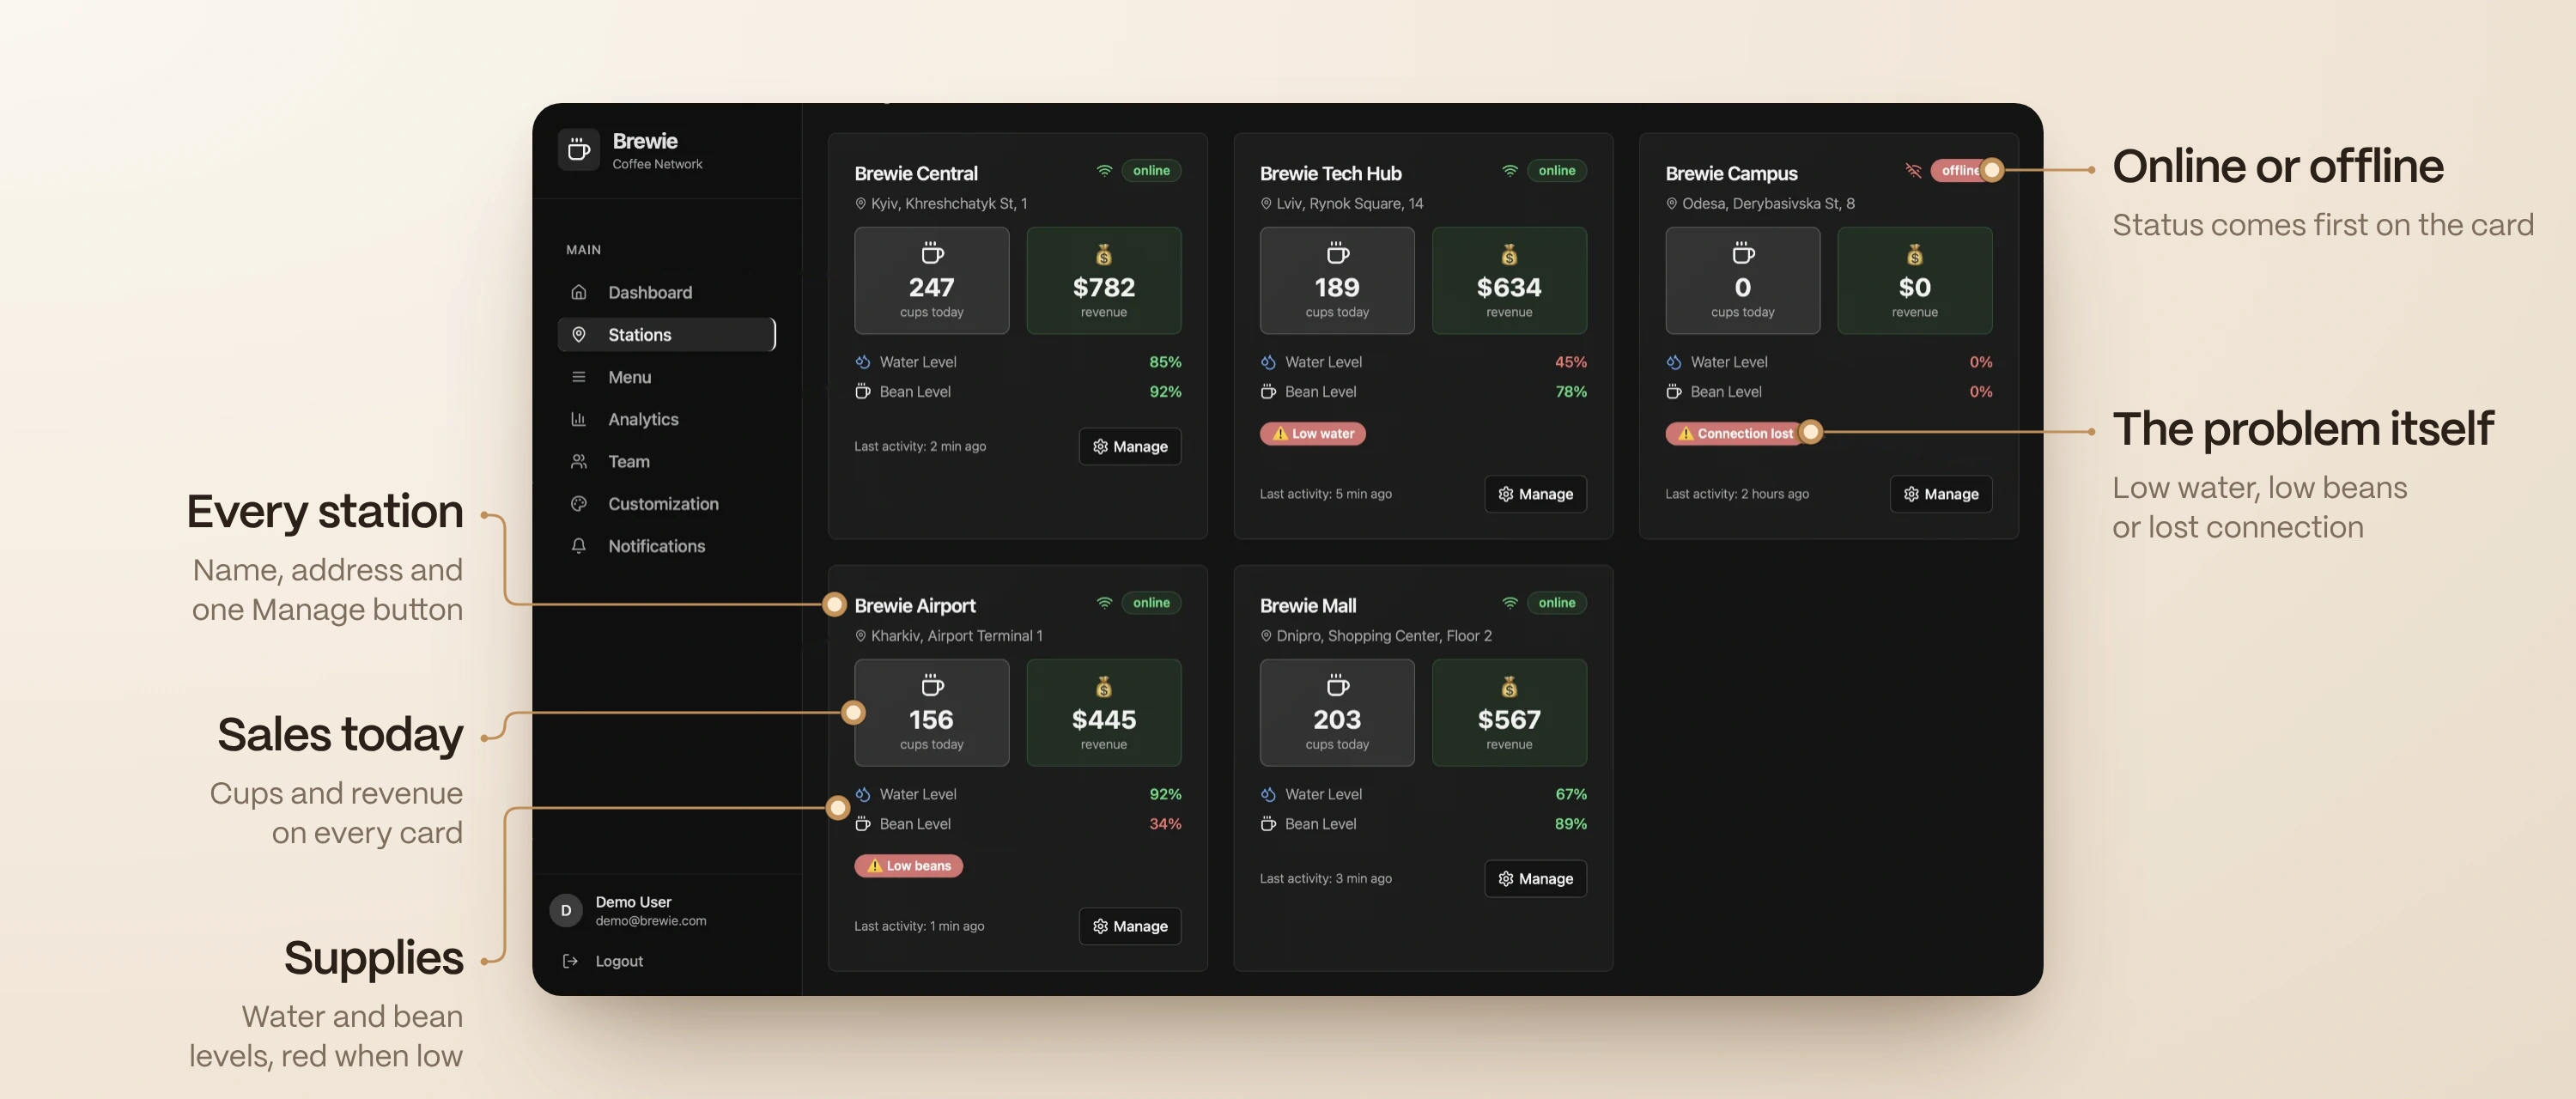
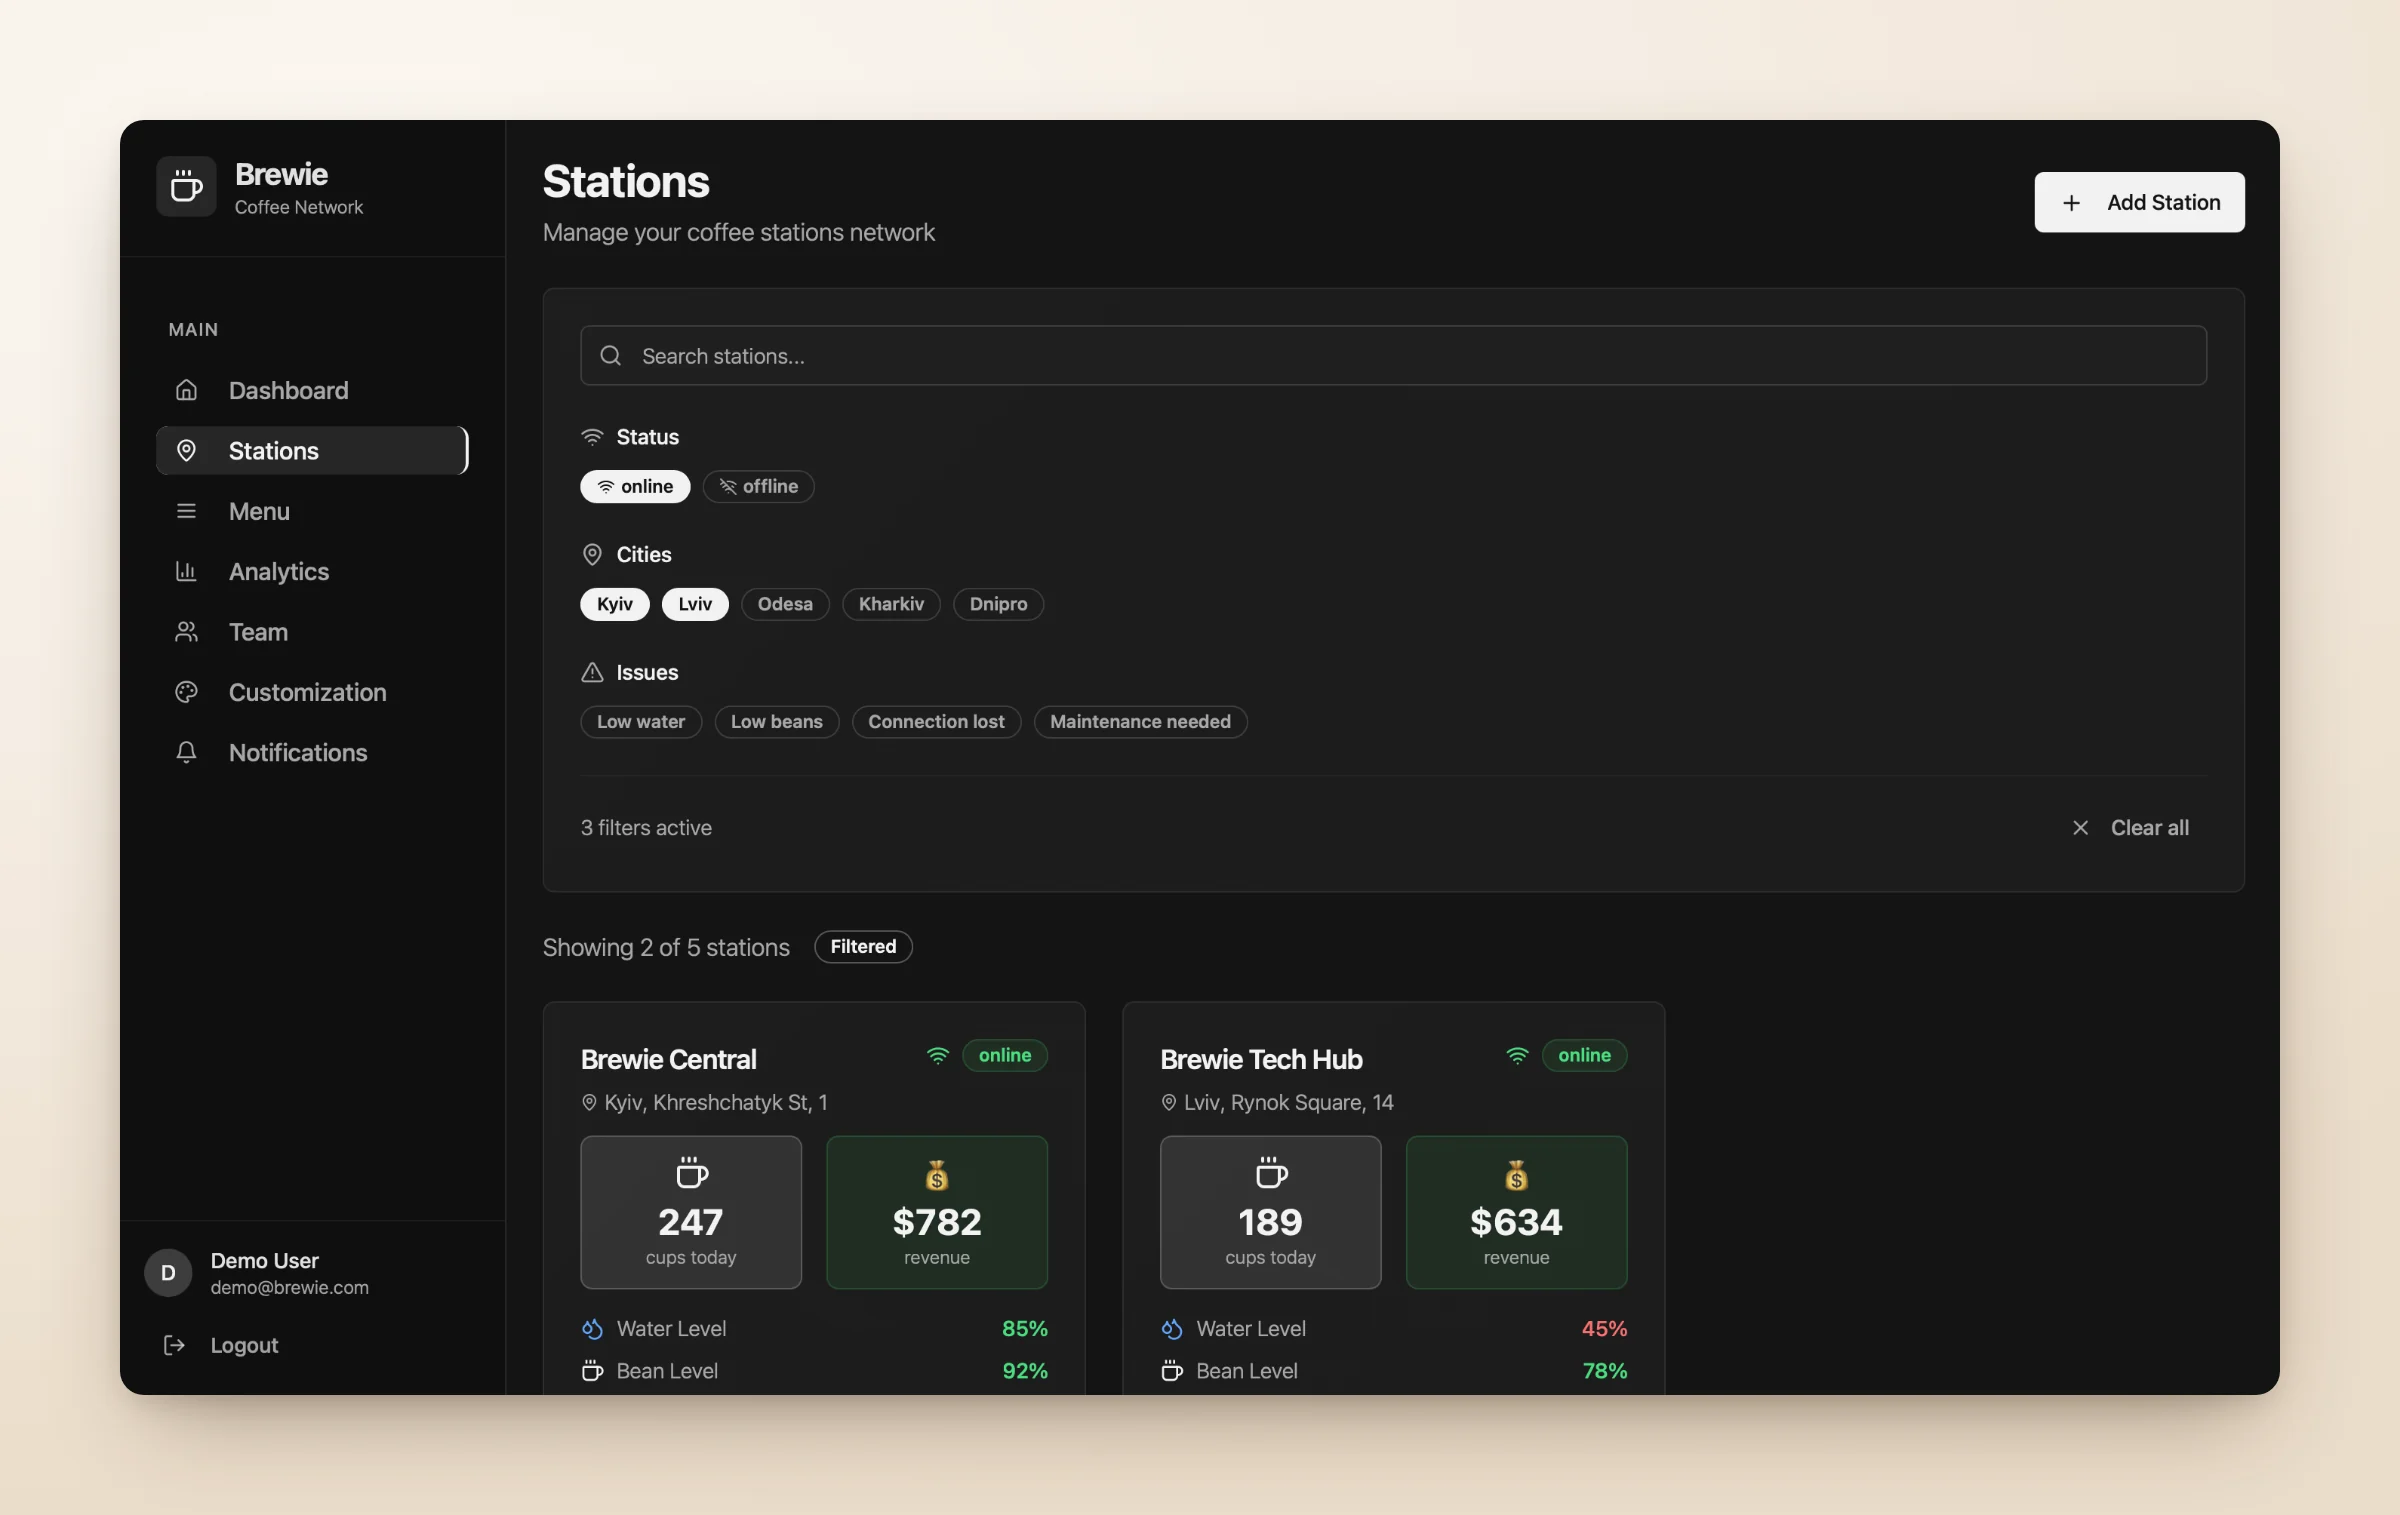
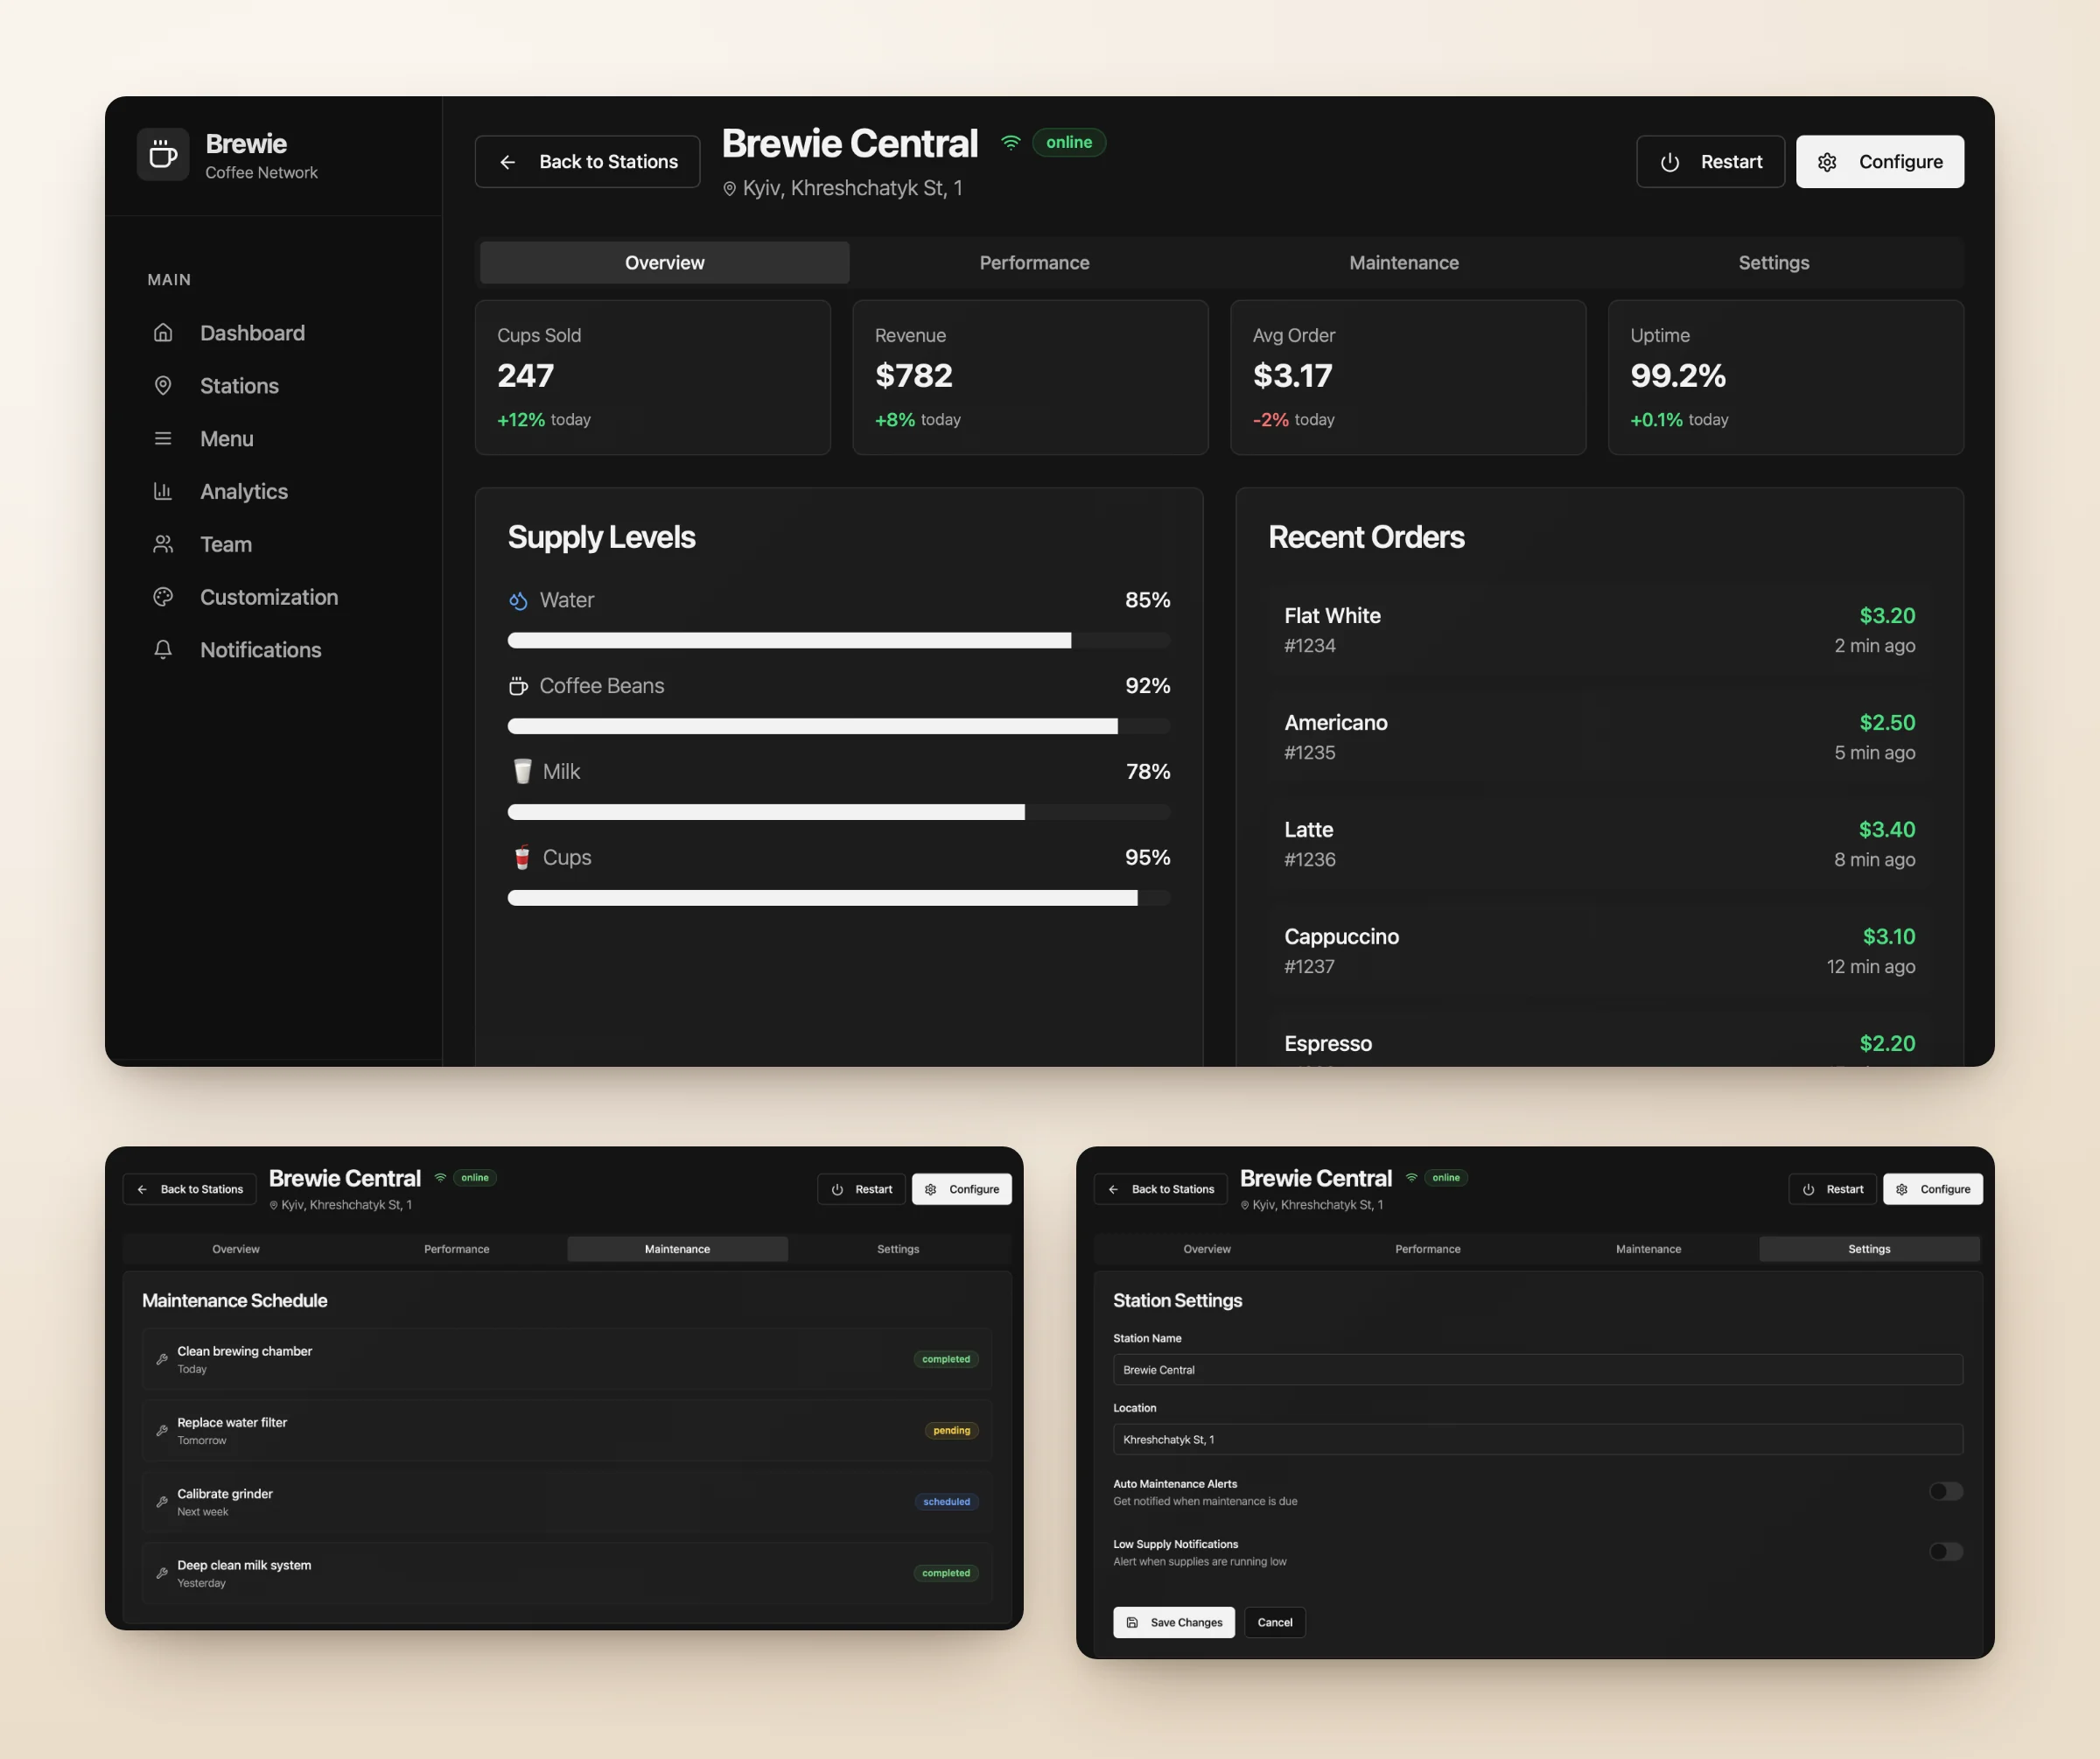
A coffee machine is more than an online or offline status. Each station has inventory levels, sales activity, maintenance needs and connection conditions that affect how it works. I designed the Stations section to bring this together and surface the most important signals before users open a machine.
What I did
- Station cards with actionable information. Status, sales, revenue and inventory, with low water, low beans, connection issues and maintenance needs highlighted on the card
- Flexible filtering. By city, status or a specific issue; filters combine, with a visible count and an option to clear them
- Detailed station views. Performance, supply levels, recent orders, maintenance schedule and settings
Why it matters
I wanted to reduce the steps between noticing something unusual and understanding what needs attention. The experience moves from the network overview to an individual station without losing context.
Turning notifications into a starting point for action
Problem 02
Design question
How might we make alerts useful rather than distracting?
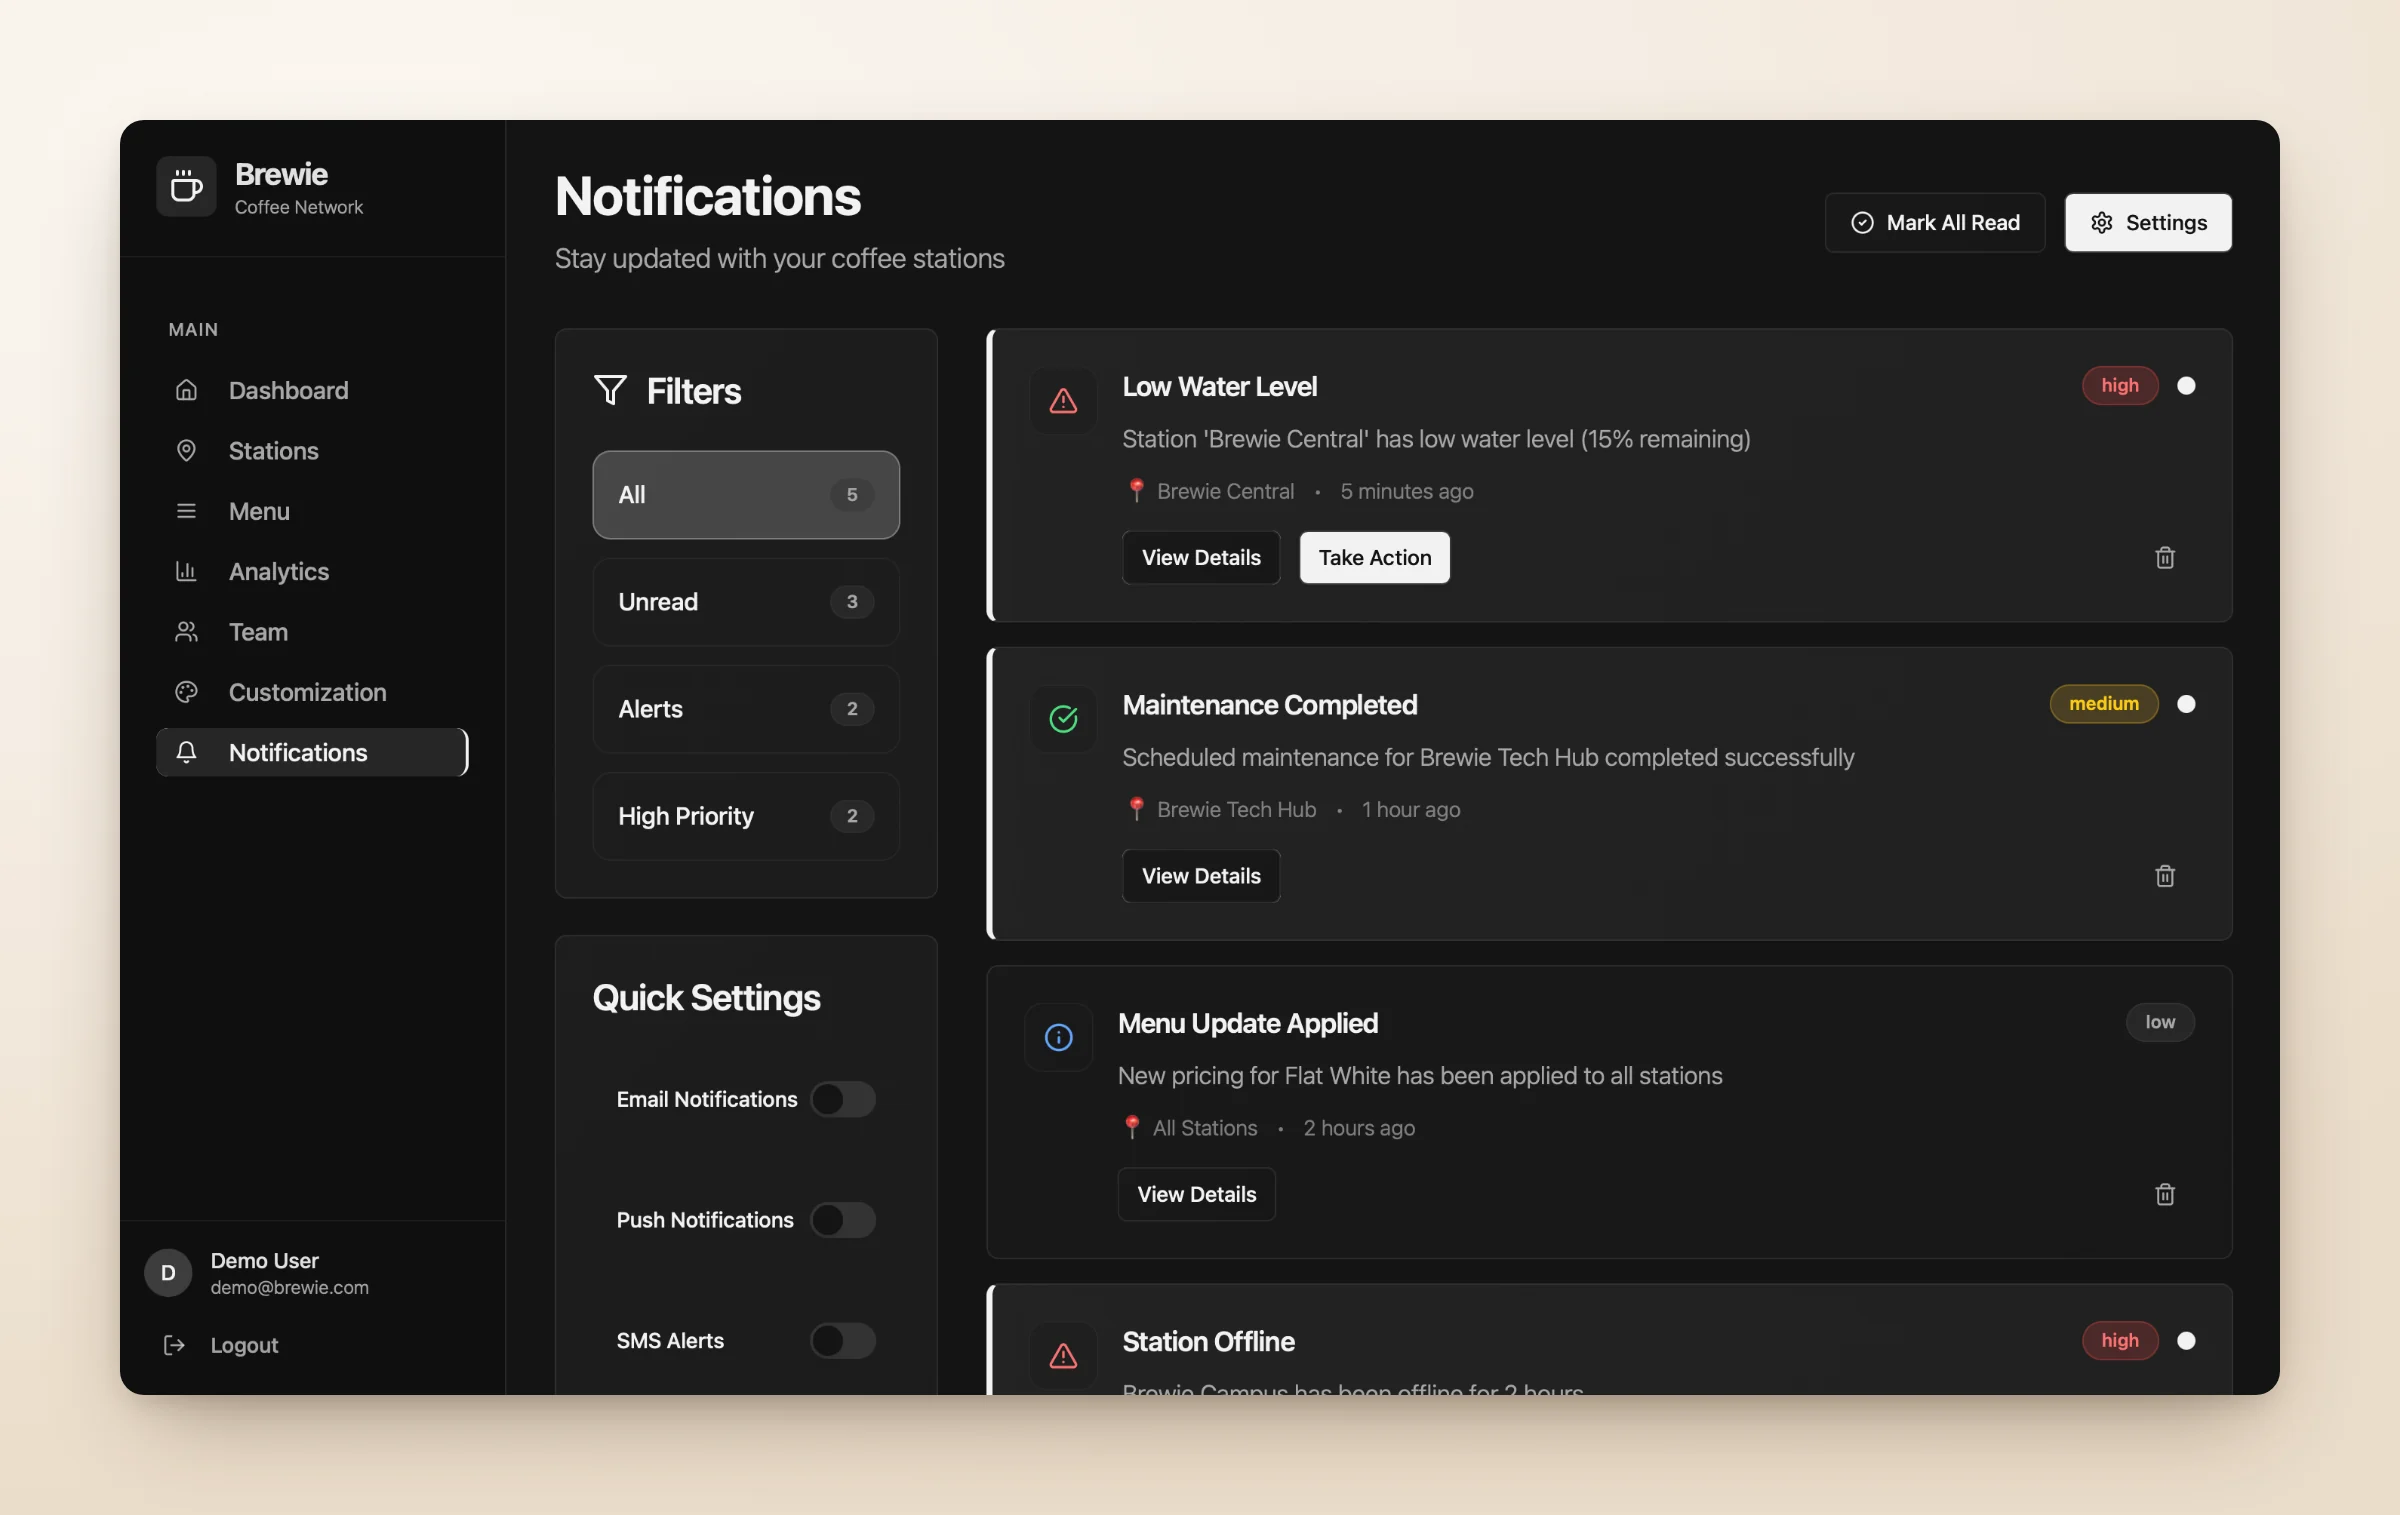
Not every event needs the same level of attention. A routine update should not compete visually with an offline machine or a critical inventory warning. I designed notifications to show what happened, where it happened and how urgently users should respond.
What I did
- Each alert shows the affected station, the issue, the time and its priority or status
- High, medium and low priority levels
- Critical issues include a direct action; other events open more details
- Settings for email, push and SMS alerts
Why it matters
Notifications become part of the operational workflow, not just a list of system messages.
- 01Identify the issue
The alert names the station, the problem and the time.
- 02Understand its priority
High, medium or low, visible at a glance.
- 03Take action
Critical issues open the right action directly.
Giving administrators control without adding complexity
Problem 03
Design question
How might we make individual station management simple across multiple locations?
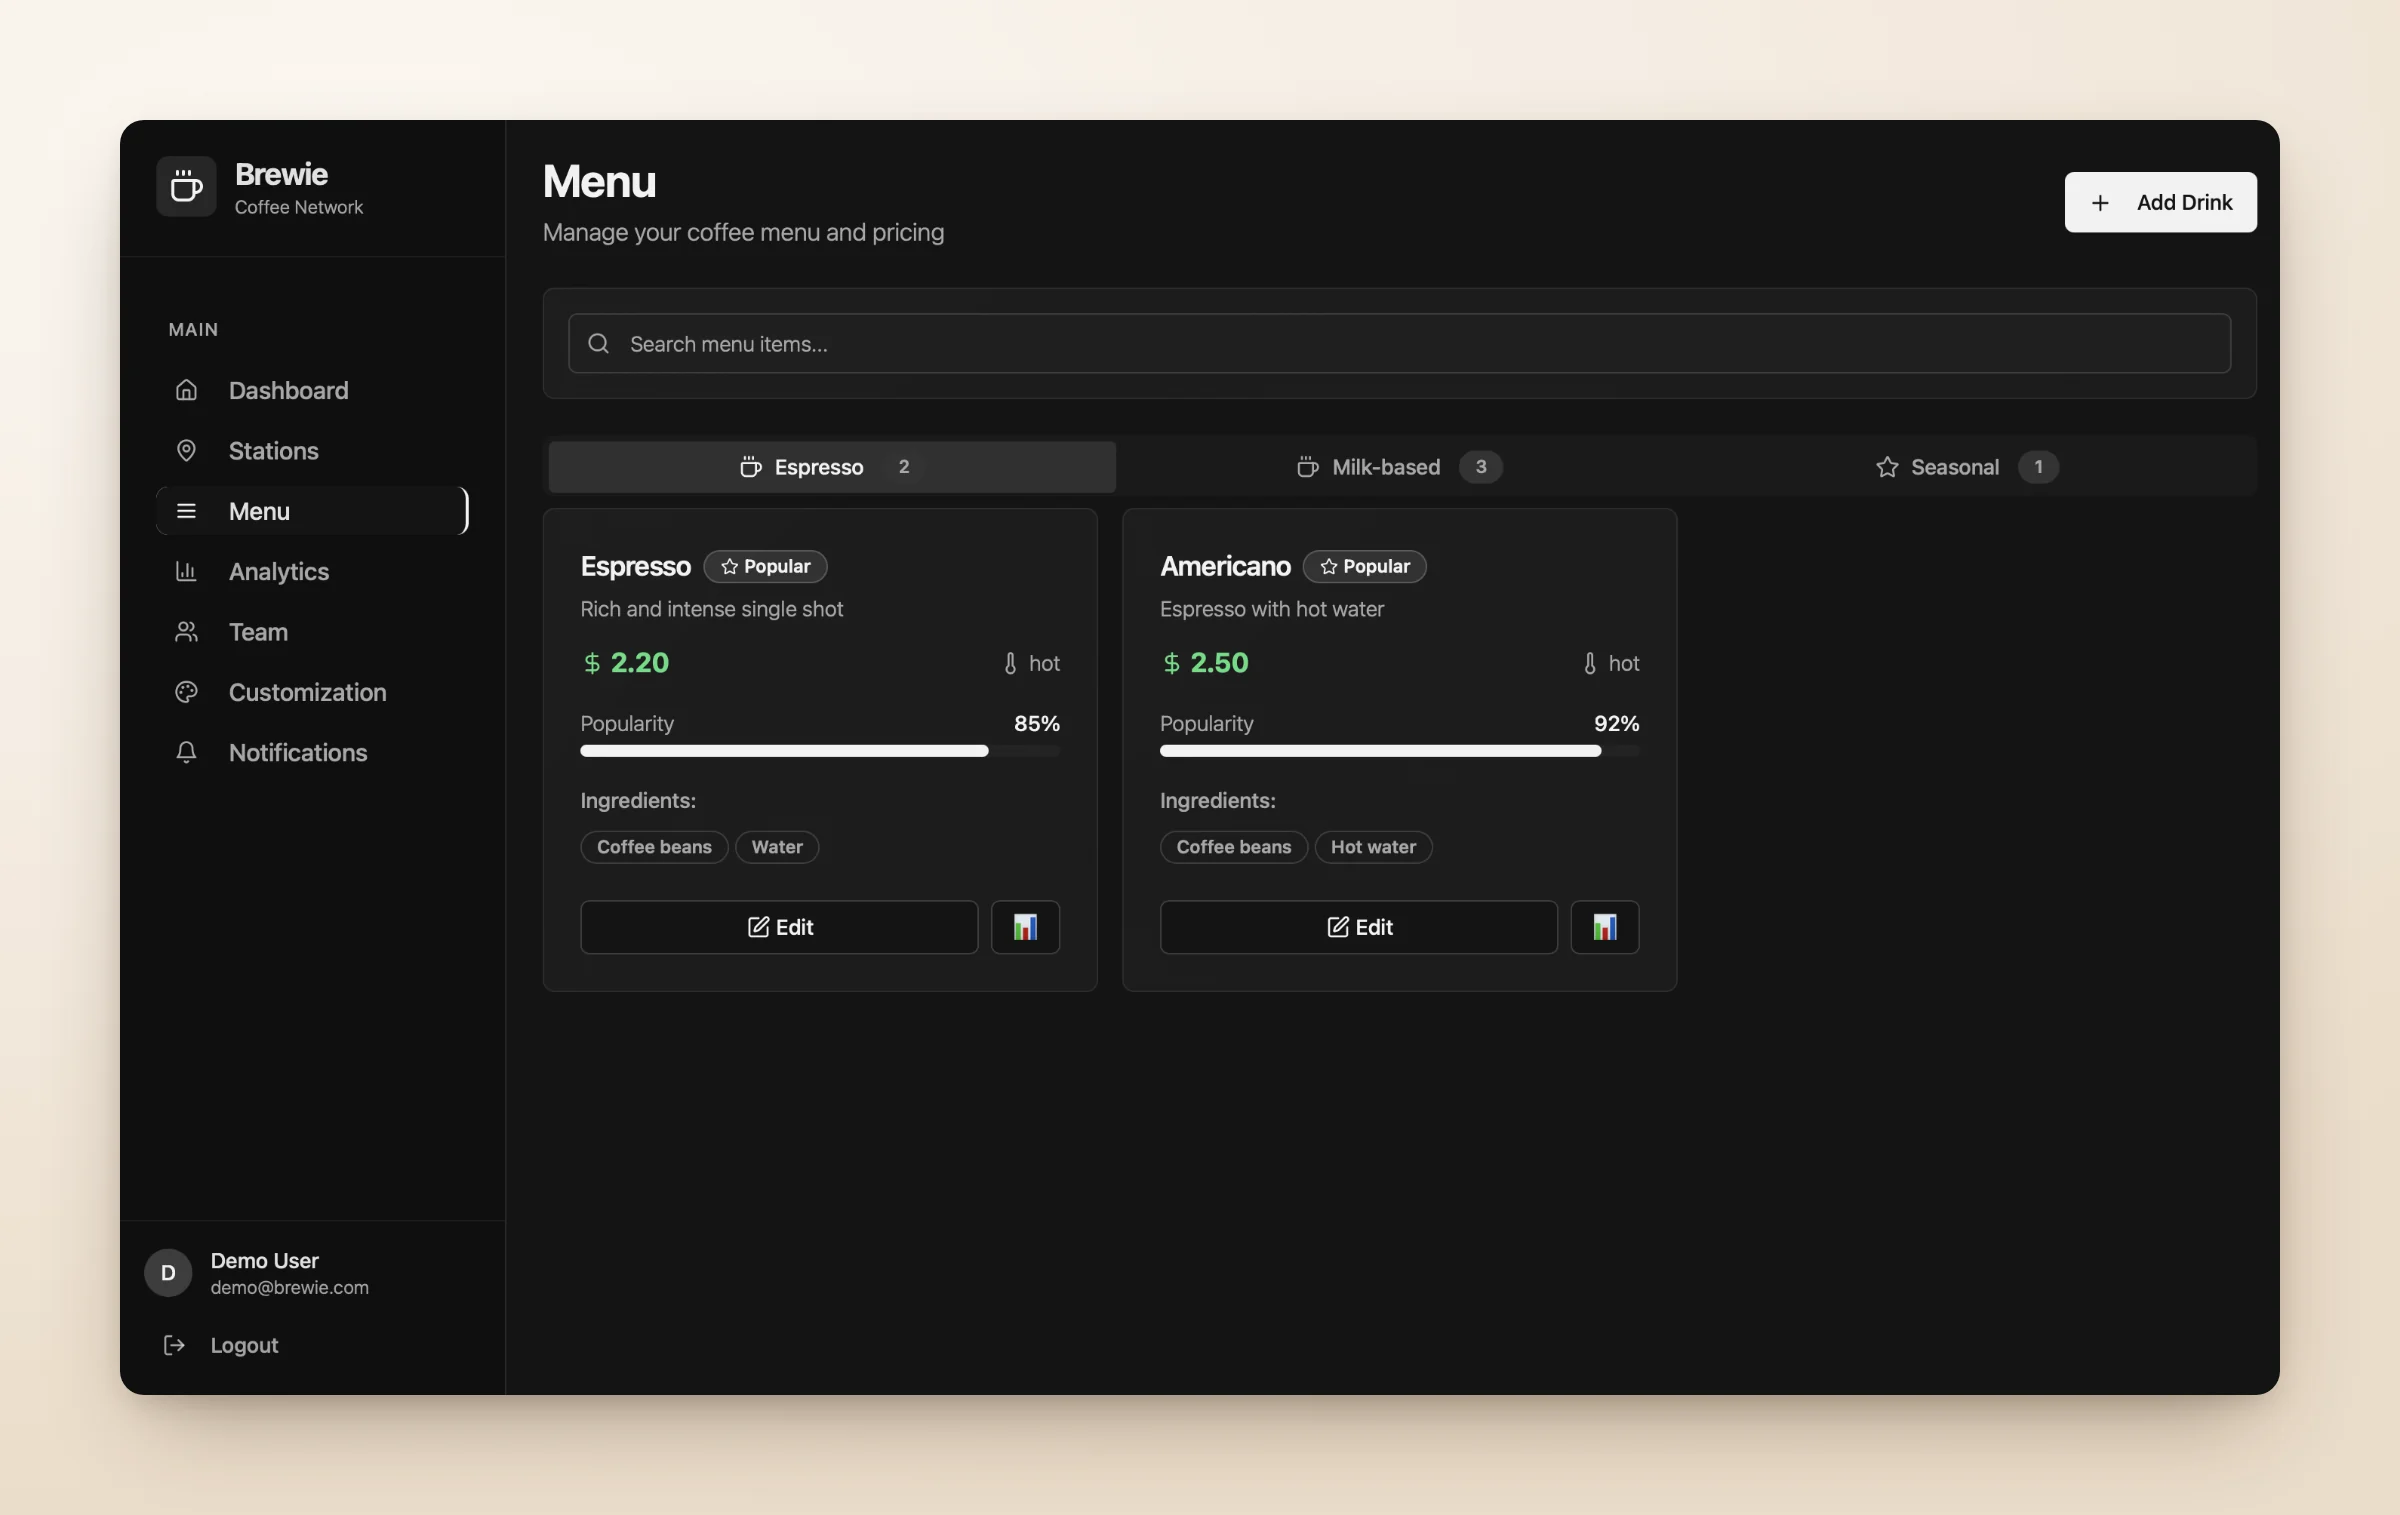
Each coffee station may have its own menu, pricing and visual identity. Putting all of these settings into one interface would make everyday updates harder, so I separated them into two connected areas: Menu and Customization.
What I did
- Menu. Drinks grouped into espresso, milk-based and seasonal, with prices, ingredients and popularity in one place
- Customization. Station name, logo, welcome message, primary colour and animation style
- Live preview. Visual changes are shown before they are saved
Why it matters
Separating functional settings from visual customization makes the experience more predictable, and the live preview makes branding changes easier to review before applying them.
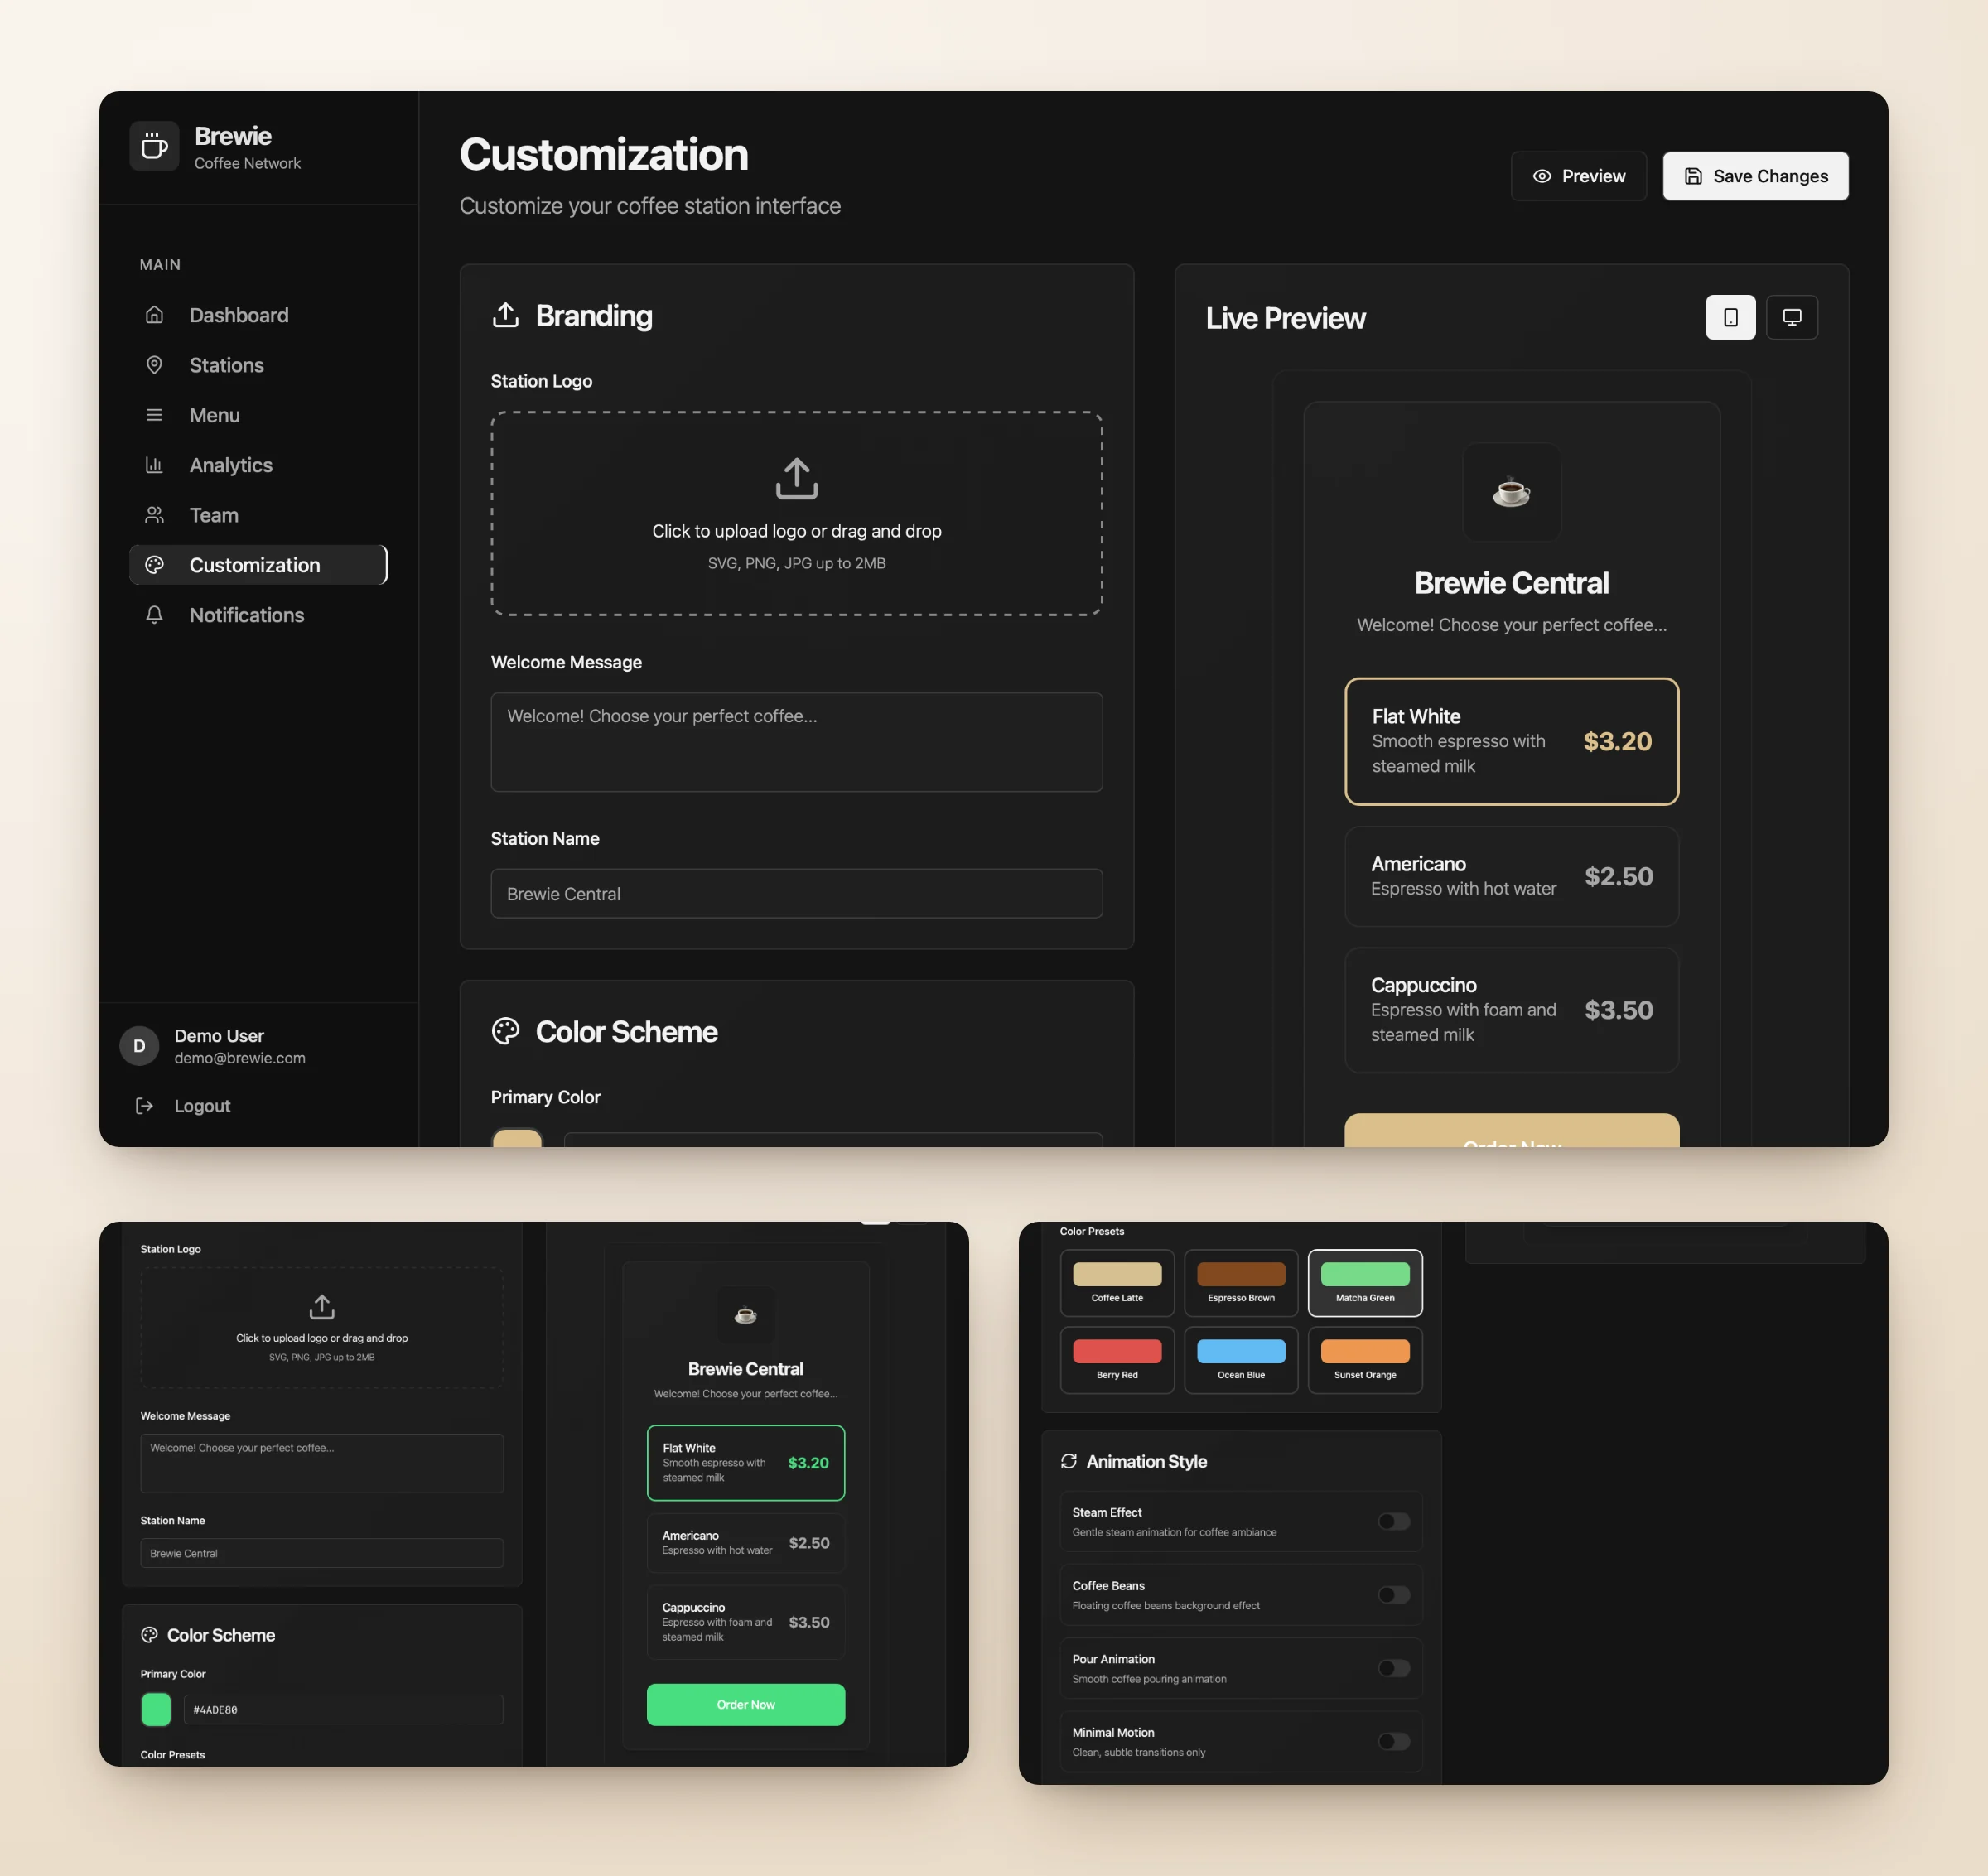
Changing the primary colour updates the live preview right away: here from Coffee Latte to Matcha Green.
Making performance data easier to understand
Problem 01
Design question
How might we help owners see where the network performs well and where it needs attention?
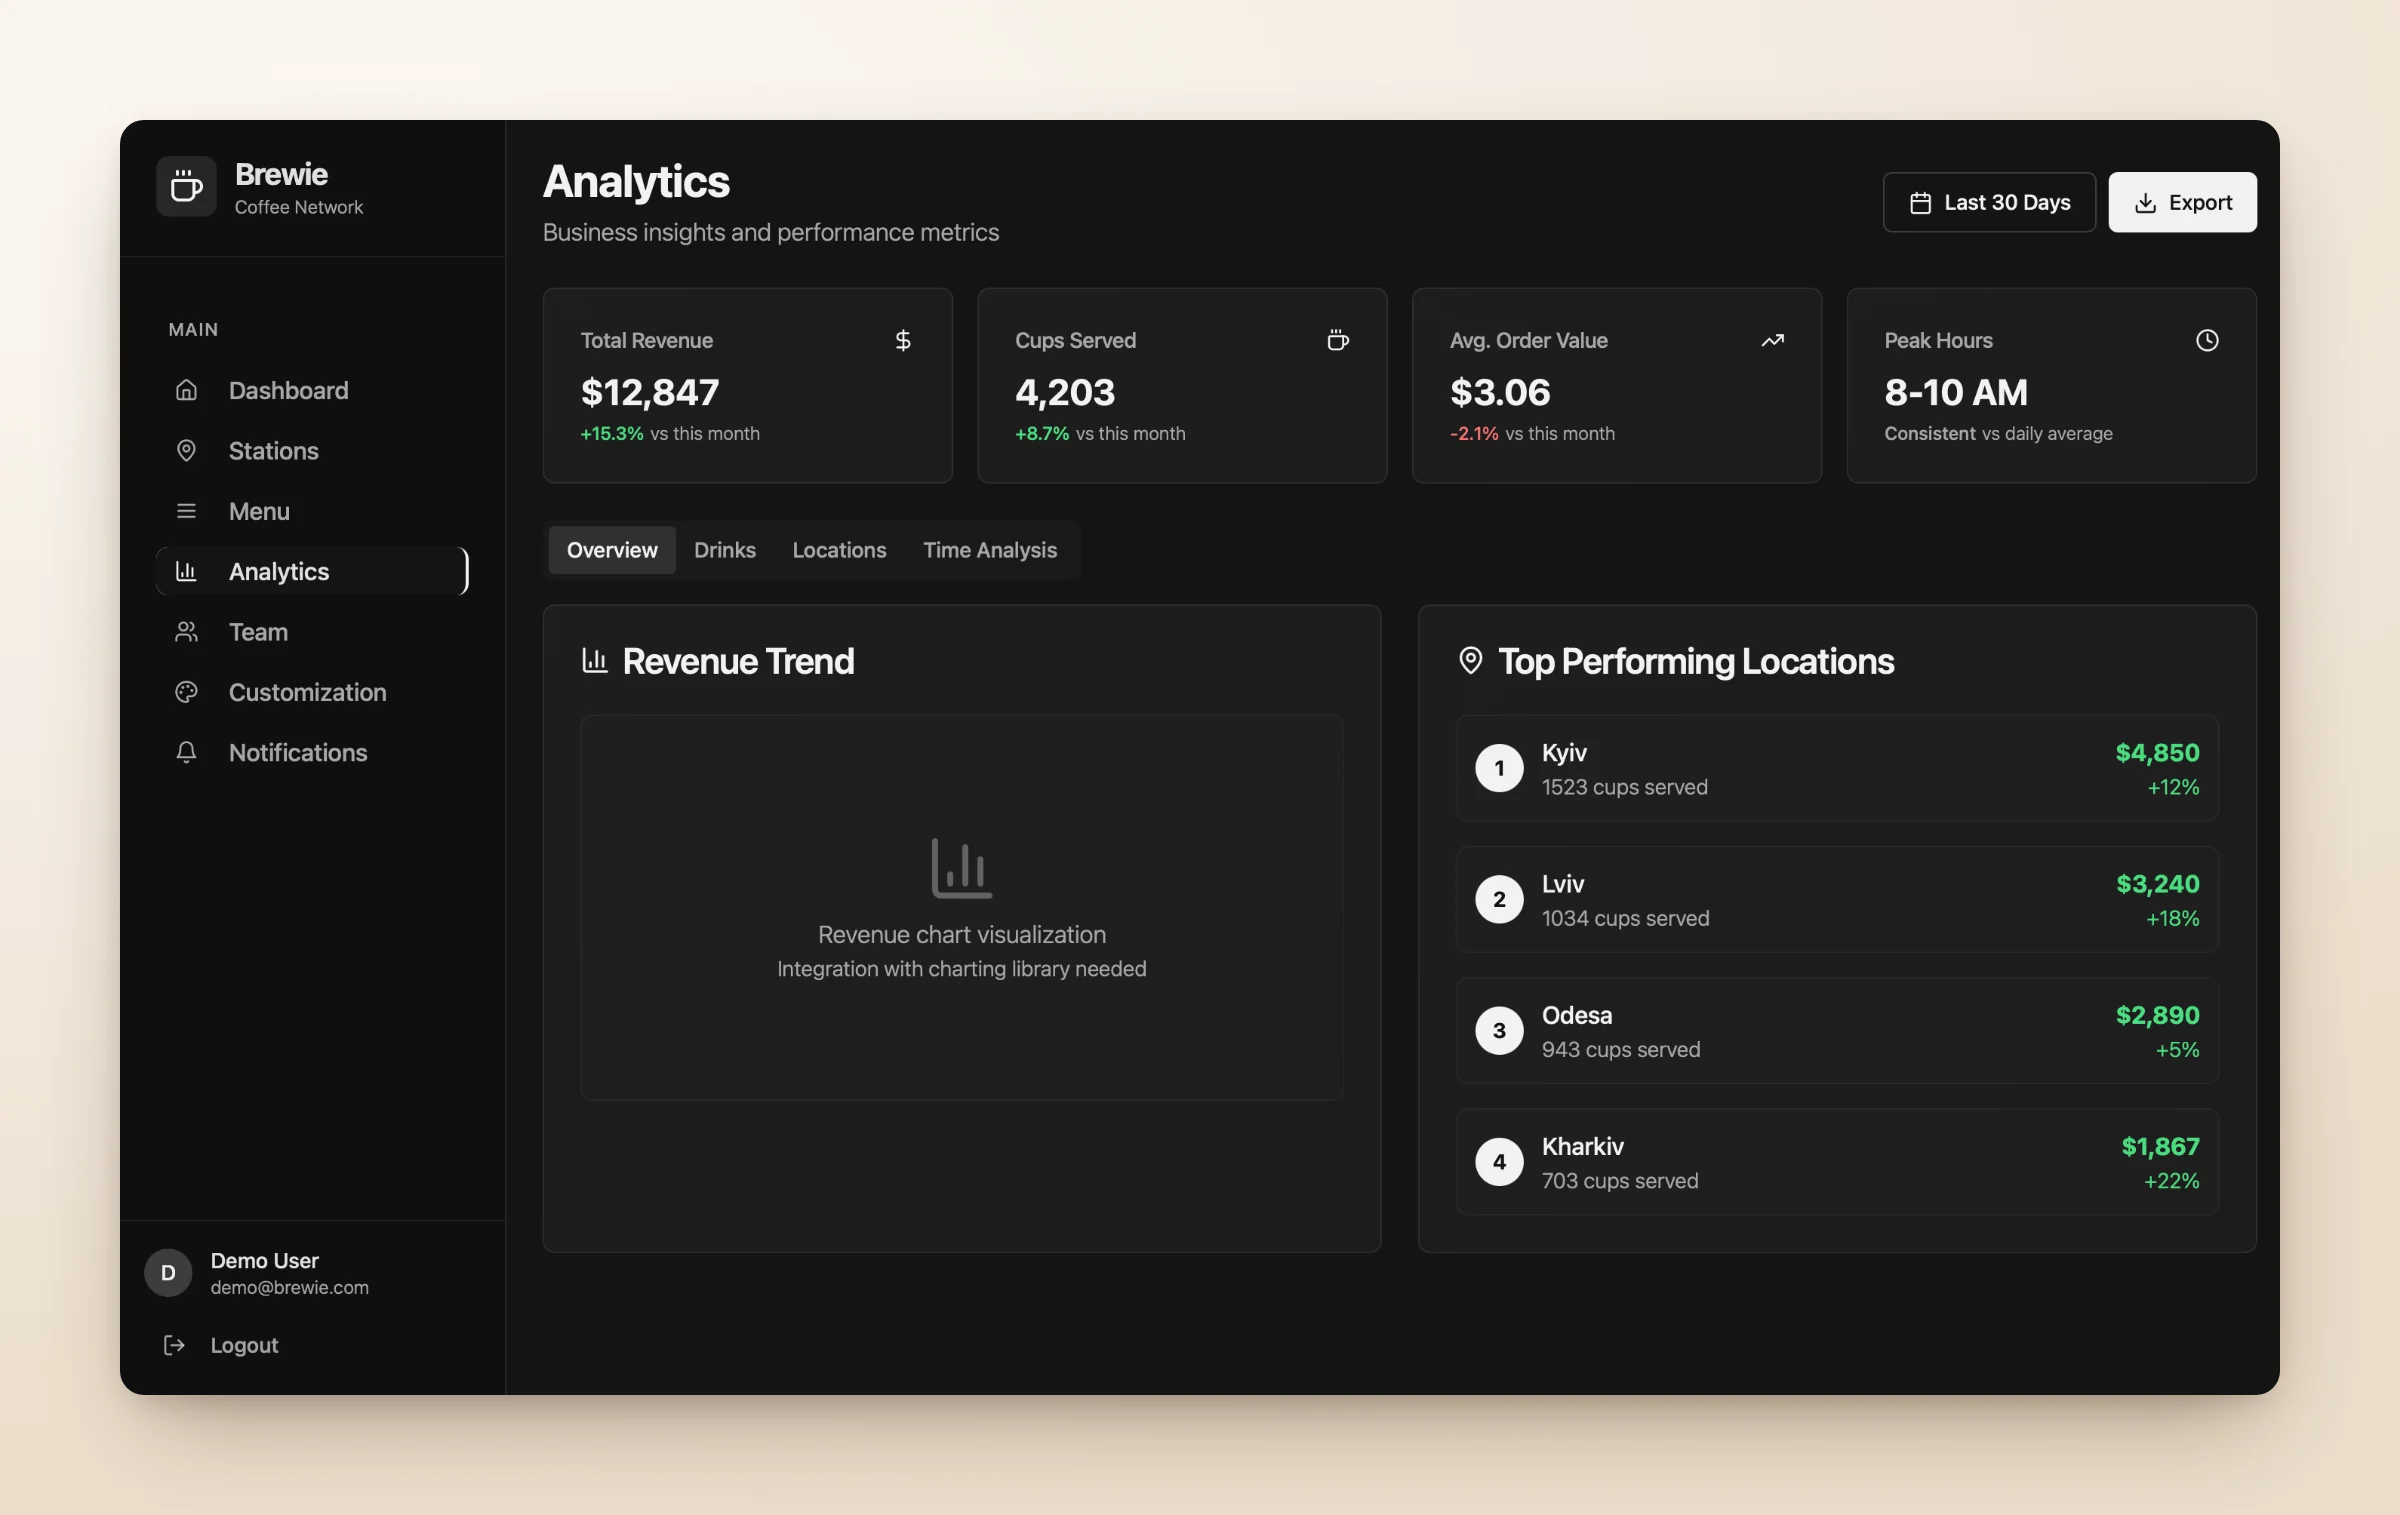
Monitoring daily operations is only one part of managing a network. Owners also need to understand performance across cities, locations and products, so I designed Analytics to turn operational data into a structured view of the business.
What I did
- Revenue, cups served, average order value and peak hours together
- Views by drinks, locations and time
- Location rankings, date selection and export for further analysis
Why it matters
The aim was to make performance differences easy to spot without working through multiple reports.
Stage 4 · Designing for different roles
One system, different responsibilities
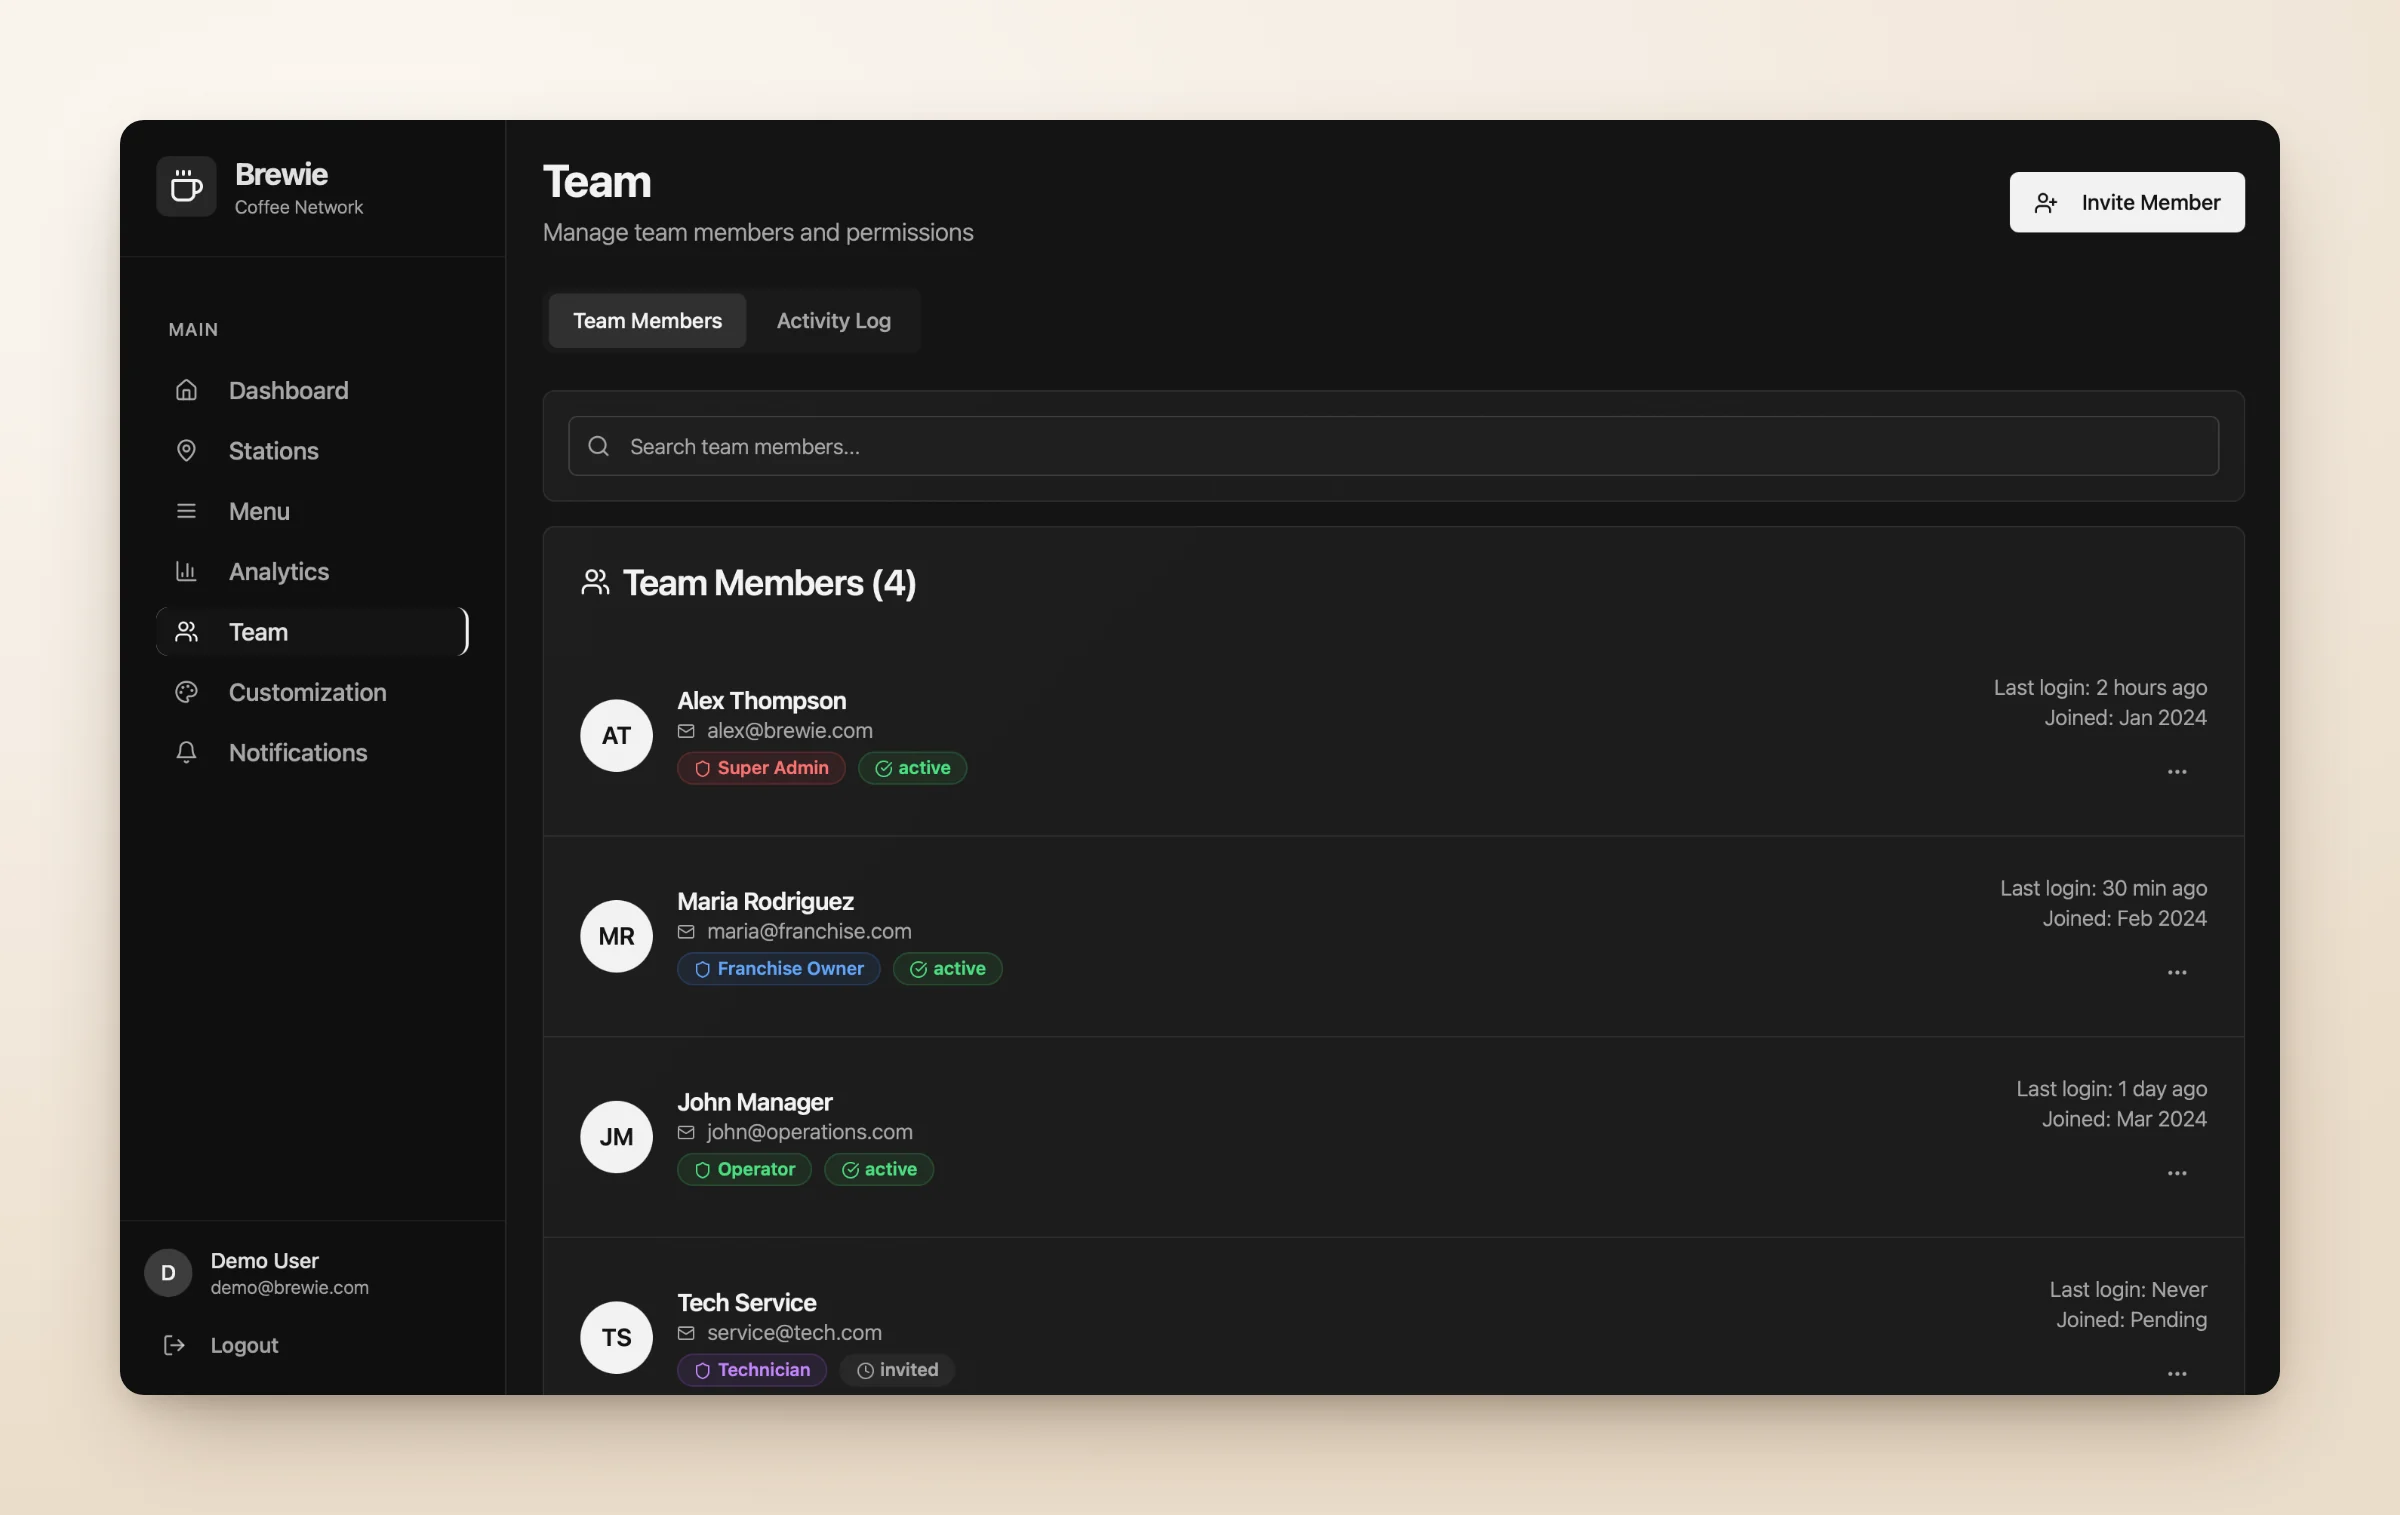
The dashboard is used by users with different levels of responsibility. A franchise owner may focus on business performance, while an operator needs everyday station information. Technicians need maintenance details, and administrators manage the wider network.
To support these needs, I designed a Team section with four roles: Super Admin, Franchise Owner, Operator and Technician. It includes member information, role labels, account status, last login and invitations, creating a clear foundation for role-based access.
Stage 5 · Design system
Building consistency across a complex product
With seven connected sections, consistency was essential. I developed a reusable design system to keep navigation, components and interactions predictable throughout the dashboard.
The interface uses a dark foundation with warm coffee-inspired accents, giving the product its own identity without distracting from operational data. Colour has a function: green for healthy or active states, orange for maintenance and warnings, red for critical or offline states.
Shared typography, spacing and component rules cover navigation, buttons, station and KPI cards, status badges, filters, form controls and notifications, so the product can grow with new stations, workflows and features.
Colours
Semantic tokens. Coffee orange is reserved for key actions and highlights.
- Background
--background - Card
--card - Secondary
--secondary - Muted
--muted - Border
--border - Sidebar
--sidebar-background - Foreground
--foreground - Primary
--primary - Coffee
--coffee-primary - Coffee Dark
--coffee-dark - Success
--success - Destructive
--destructive
Typography
One type scale with clear hierarchy.
- Coffee station analyticsDisplay / H1 · 36 · Bold
- Coffee station analyticsH2 · 24 · Semibold
- Coffee station analyticsH3 · 18 · Semibold
- Coffee station analyticsBody · 16 · Regular
- Coffee station analyticsSmall · 14 · Muted
- Coffee station analyticsCaption · 12 · Uppercase
Spacing
4px base grid. Cards use 24px padding, sections 64px gaps.
- 4px
- 8px
- 16px
- 24px
- 32px
- 48px
- 64px
Buttons
Same height per size. One primary action per view.
Badges and status
Status of stations and orders.
Navigation
Sidebar items and tabs.
- Dashboard
- Stations
- Analytics
Alerts
Feedback messages with icon, title and short description.
Icons
Lucide, 1.5–2px stroke. 16px inline, 20px navigation, 24px headers.
Results
From disconnected operations to one unified experience
The final design brings the main workflows of a self-service coffee network into one dashboard: seven connected sections, reusable UI components and detailed interfaces for everyday operational tasks.
I designed and reviewed the core flows: station filtering, issue visibility, menu editing and station customization. For handoff and stakeholder communication, I prepared a UI kit, light and dark interface variants and an animated product walkthrough.
- Centralized visibility
One interface for monitoring stations, business performance and operational issues.
- Clearer workflows
A structure that connects station monitoring, issue detection and the right actions.
- Flexible location management
Tools for menus, pricing, branding and team information.
- A scalable UI foundation
Reusable components and consistent interaction patterns across the product.
These are design deliverables and intended product benefits. Their impact on operational efficiency would need to be validated through real usage.
Designing Brewie showed me how important it is to organize complex B2B experiences around users’ decisions, not just the available data. The hardest part was deciding what deserved immediate attention, what belonged in a detailed view and how users should move between monitoring and managing the network.
What I would measure next
- Time to resolution
How long it takes users to identify and resolve an offline station or low-inventory issue.
- Workflow efficiency
Whether operators complete daily tasks without switching between multiple tools.
- Task completion
Whether administrators update menus, prices and branding on their own, without unnecessary steps.